Research Article
Volume 4 Issue 3 - 2022
A Note on Interlinking of Rivers: An Indian Example [Part-III]
Formerly Chief Technical Advisor – WMO/UN & Expert – FAO/UN Fellow, Telangana Academy of Sciences [Founder Member] Convenor, Forum for a Sustainable Environment Hyderabad, TS, India
*Corresponding Author: S. Jeevananda Reddy, Formerly Chief Technical Advisor – WMO/UN & Expert – FAO/UN Fellow, Telangana Academy of Sciences [Founder Member] Convenor, Forum for a Sustainable Environment Hyderabad, TS, India.
Received: March 17, 2022; Published: August 03, 2022
Abstract
In India Interlinking of rivers has its origin around one & half Century back, which aims to transfer water from surplus water basin to deficit water basins. Now it turned in to a political satire! It started with linking of Ganga with Cauvery and finally bogs down to linking of Godavari with Cauvery; though Ganga is surplus basin and Godavari basin is not but seasonal. NWDA now has new proposal, which is under consultation stage, though Bachawat Tribunal cleared 1980/81 linking of Godavari with Krishna through Polavaram Dam by “Gravity”. NWDA proposal aims at taking 247 tmc ft from Inchampalli in TS through “Power based Lifting of Water”. It was proposed to distribute 247 tmc ft among AP, TS. TN, Karnataka & Pondicherry respectively are 90, 80, 45, 25 & 5 tmc ft. By linking in upper riparian state Bachawat Tribunal proposal of using of surplus water to counter deficit years, negates this right of lower riparian state. For assessing the surplus and deficit water condition hither to no realistic approach was proposed. The following three factors must be taken in to account on yearly basis, namely (1) Annual water flows in Godavari River follow the 60-year cycle seen in all-India annual & southwest monsoon average rainfall. It is known as natural rhythmic variation, a main component of climate change; (2) During below the average rhythmic period in rainfall, if El Nino occurs drought conditions intensifies; & (3) During above the average rhythmic period in rainfall, if a severe cyclonic storm occurs it creates severe surplus water condition; and thus large part of it goes in to the Sea to safeguard the dams. This does not come under surplus water availability. In addition to these, the major component to be taken into account is data set selection. It should be normally distributed with Mean = median, if the data series follow rhythmic variation. All these are explained in the article.
Keywords: Linking of rivers; Climate change; Godavari River; ENSO; Cyclonic Storms; Natural rhythmic variations; Surplus water; Deficit water
Introduction
Interlinking of Rivers [ILR] aims to transfer water from surplus water basins to deficit water basins in the country. Rivers with Himalayan origin are generally termed as surplus water basins as they are perineal in nature; and those rivers from the south being seasonal are not surplus basins in true sense. They are dependent of several localized conditions. ILR helps saving the people living in drought-prone zones from hunger and people living in flood-prone zones from the destruction caused by devastating floods. The idea of ILR has its origin a century and half back. The sequences of such initiations are given as follows:
- During the British raj, an engineer Sir Arthur Cotton had sought to link the Ganga with Cauvery to improve connectivity for navigation among the areas
- Union Water Resources Minister K. L. Rao in 1972 proposed transferring water from surplus Himalayan Rivers to water-scarce regions in western and peninsular India through linking of Ganga with Cauvery below Patna
- In 1982, Prime Minister Indira Gandhi set up the National Water Development Agency [NWDA] to take the plan further. --- Supreme Court, gave its go-ahead to ILR and asked the government to ensure that the project is implemented expeditiously
- However all these proposals were shelved due to improved rail network and later due to north-south animosity in sharing of water
- As a result, alternate paths were proposed, a bad policy in real terms. NWDA has assessed the water balance position in various peninsular river basins keeping in view the ultimate development scenario in these basins. Based on these studies:
- NWDA has formulated proposals for diversion of 430 tmc ft of water annually from Mahanadi through Mahanadi-Godavari link canal. From Godavari, a quantity of 925 tmc ft of water (including water brought from Mahanadi) is envisaged to be diverted to Krishna River through three links via Inchampalli - Nagarjunasagar, Inchampalli - Pulichintala and Polavaram – Vijayawada;
- Out of this water brought from Godavari, a quantity of 498 tmc ft is envisaged to be diverted from Krishna to Penna through three link canals via Almatti - Penna, Srisailam - Penna and Nagarjunasagar - Somasila. From Penna, a quantity of 303 tmc ft of water is proposed to be diverted to Cauvery River through Somasila-Grand Anicut link and further down south Cauvery-Vaigal - Gundar link canal to meet the demand of areas lying below Cauvery River up to Gundar basin in Tamil Nadu State.
- The third project is the Krishna (Srisailam) – Penna River linking which has already been executed through Telugu Ganga Project except for building four mini hydel power projects. AP is unable to resolve a minor issue on Polavaram with Odisha and Chhattisgarh, how this big issue connecting several states could be solved? The main critical problem is how to share by riparian states during “dry years”;
- Bachawat Tribunal followed a pragmatic approach but Brijesh Kumar Tribunal followed a negative path, known as “Technical Fraud path” favouring upper riparian states. However, it appears that in all these assessments they haven’t taken in to account the climate change related flows and cyclonic activity related flows; & ENSO related flows. These must be taken in to account to achieve sustainable flows.
Sir Arthur Cotton constructed a barrage across the River Godavari near Dawaleswaram in 1847-52 and on river Krishna at Vijayawada in 1852-55. They have limited storage capacities – used for transport. To protect these two barrages from floods fury flood flows have been released in to Bay of Bengal that becomes a wastewater? Any attempt to stop such water in upper regions will result disastrous effect on dams.
Indian rainfall is highly variable and follows the natural rhythmic variations (Reddy, 2000). Water flows in rivers also follow the rainfall patterns (Reddy, 2016) – droughts & floods. The other important factor is cyclonic activity (Reddy, 2021). These are important components for Krishna and Godavari Rivers flows (Reddy, 2019a). Also ENSO presented a clear cut impact on Indian rainfall (Reddy, 2008). Table 1 presents sources of irrigation in India during 1960-61, 1999-20 & 2013-14.
| Source | 1960-1961 | 1999-2000 | 2013-14 ------%/Mha -------- |
| Canals | 42.05/10.37 | 31.29/17.45 | 23.90/16.278 |
| Tanks | 18.50/04.56 | 05.18/02.94 | 02.70/001842 |
| Wells | 29.56/07.29 | 57.81/24.70 | 62.32/42.438 |
| Others | 09.89/02.44 | 05.73/02.93 | 11.07/007542 |
Table 1: The area under irrigation under different sources and in different periods in India.
Role of Few “Factors” on Rainfall
Introduction
Odisha government argued that there is no surplus water in Mahanadi River – so 430 tmc ft of water is out. Here other important point is Chhattisgarh government also said no surplus water [147 tmc ft] in Indravati River. With these now it bogs down to 247 tmc ft. Here the basic issue is there should not be any type of compromise with the lower riparian state [AP] interests, such as.
- During low water availability years nobody can stop upper riparian states use their share fully or even more like Karnataka & Maharashtra states in Krishna River basin. In such cases, to rescue lower riparian state Bachawat Tribunal allowed lower riparian state to use surplus water in surplus water years and face the deficit in deficit water years
- That means, through Polavaram Dam the interlinking must take place and not from Inchampalli in TS if there is sustainable surplus water. Otherwise upper riparian states empty the Godavari River flows upstream.
- Also, Bachawat Tribunal cleared linking of Godavari with Krishna through Polavaram Dam for about 80 tmc ft. Here it is AP’s responsibility to balance out the water.
Under ILR, the Godavari River Basin is considered as a surplus one, while the Krishna River basin is considered to be deficit one – both are seasonal. Based on the estimated water requirements in 2025, the study recommended that sizeable surplus water was to be transferred from Godavari River Basin to the Krishna River Basin. Government decided to re-look at Godavari-Krishna Rivers ILR in terms of water availability. NWDA decided to get the latest water availability figures. However, in such assessments they rarely looked in to the climate change related flows, cyclonic activity related flows and ENSO related flows. Reddy (2021) presented the issue related to cyclonic activities in Bay of Bengal & ENSO. Regarding climate change – natural variability in rainfall/Rhythmic Variations -- issues (Reddy, 1993, 2000, 2008, 2016 & 2019 a&b) discussed.
Role of Rhythmic Variations on Rainfall
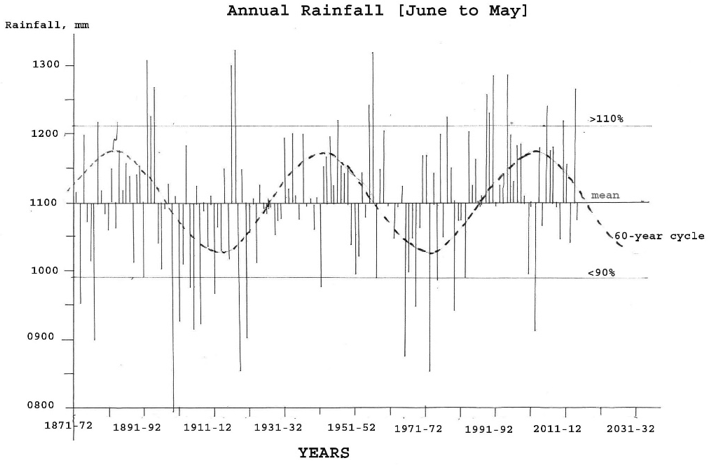
Reddy (2000 & 2008) observed 60-year cycle in all-India southwest monsoon average [June to September] rainfall. The rainfall data was taken from Parthasarathy, et al. (1995) for the period 1871 to 1994. To this data set added later data of Central Water Commission (CWC) for 1985-86 to 2014-15 (Reddy, 2019a). The Chinese Astrological cycle of 60-years is lagging behind by three years to Telugu Astrological cycle of 60 years. Figure 1 follows the Telugu Astrological cycle that presents the all-India annual average rainfall of June to May for the period 1871-72 to 2014-15. In this figure also presented the 60-year cyclic pattern.
Reddy (2000 & 2008) observed 60-year cycle in all-India southwest monsoon average [June to September] rainfall. The rainfall data was taken from Parthasarathy, et al. (1995) for the period 1871 to 1994. To this data set added later data of Central Water Commission (CWC) for 1985-86 to 2014-15 (Reddy, 2019a). The Chinese Astrological cycle of 60-years is lagging behind by three years to Telugu Astrological cycle of 60 years. Figure 1 follows the Telugu Astrological cycle that presents the all-India annual average rainfall of June to May for the period 1871-72 to 2014-15. In this figure also presented the 60-year cyclic pattern.
In Indian Parliament, members raised a question: “Is Indian rainfall decreasing?” The government response was “yes”. This is a false reply, as we can see from Figure 1 that the Government agencies used the data set of 2nd cycle wherein the first 30 year period is above the average and the next 30 years form below the average [1957/58-1986/87] and thus presented a decreasing trend. If they would have shifted 30 years backwords or 30 years forwards then this would have given them increasing trend for the 60-year period.
Figure 1 presented two full 60-years cycles and the third cycle started in 1987/88 – same is the case with southwest monsoon [June to September] rainfall. The above the average 30 year period completed by 2016/17 and below the average 30 year part started in 2017-18 and will continue up to around 2046/47 -- CWC data forms part of above the average.
Role of ENSO Activity on Rainfall
Though ENSO [SO] is a single climate phenomenon, but it has three states, or phases. The two opposite phases, “El Niño” and “La Niña,” and “Neutral” is in the middle of the continuum.
Though ENSO [SO] is a single climate phenomenon, but it has three states, or phases. The two opposite phases, “El Niño” and “La Niña,” and “Neutral” is in the middle of the continuum.
- El Niño: A warming of the ocean surface, or above-average Sea Surface Temperatures (SST), in the central and eastern tropical Pacific Ocean. Over Indonesia, rainfall tends to become reduced while rainfall increases over the tropical Pacific Ocean.
- La Niña: A cooling of the ocean surface, or below-average Sea Surface Temperatures (SST), in the central and eastern tropical Pacific Ocean. Over Indonesia, rainfall tends to increase while rainfall decreases over the central tropical Pacific Ocean.
- Neutral: Neither El Niño or La Niña. Often tropical Pacific SSTs are generally close to average. However, there are some instances when the Ocean can look like it is in an El Niño or La Niña state.
| SO Events | Number of Years | |||||
| D | BN | N | AN | E | Total | |
| El Nino | 7 | 5 | 5 | 0 | 1 | 18 |
| Neutral | 14 | 13 | 37 | 14 | 6 | 84 |
| La Nina | 0 | 0 | 7 | 7 | 10 | 24 |
| Total | 21 | 18 | 49 | 21 | 17 | 126 |
D = Deficit, BN = Below Normal, N = Normal, AN = Above Normal, E = Excess Rainfall
Table 2: Southern Oscillation [SO] versus Indian Southwest Monsoon Rainfall [1880-2006].
Table 2: Southern Oscillation [SO] versus Indian Southwest Monsoon Rainfall [1880-2006].
Table 2 presents the grouping of 1880-2006 – 126 years – Indian Southwest Monsoon Rainfall with the southern oscillation (SO) events, namely El Nino, La Nina and neutral under deficit [D], below normal (BN), normal (N), above normal (AN) and excess (E) rainfall groups. El Nino was present in 18 years and La Nina in 24 years out of 126 years. The rest 84 years were under neutral condition. Also in 49 years it was under normal rainfall and deficit in 21 years & excess in 17 years.
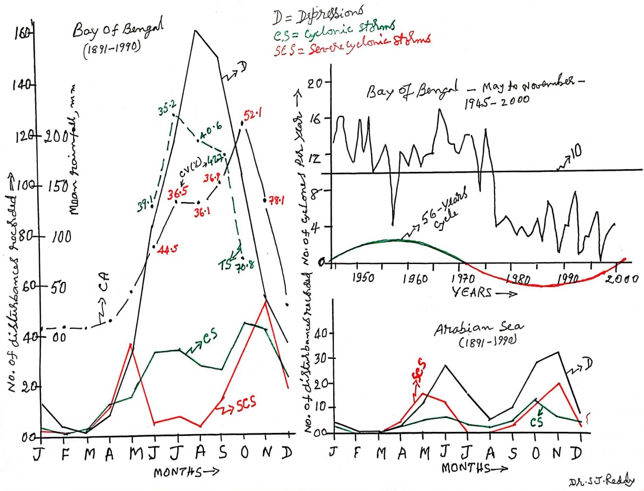
Figure 2: Number of depressions, cyclones & severe cyclones recorded during 1891-1990 in Bay of Bengal and Arabian Sea; natural variability in cyclonic storms in Bay of Bengal during 1945-2000 & mean of 1871-1990 monthly rainfall over Coastal Andhra Pradesh and Telangana met sub-divisions.
Role of Cyclonic Activity on Rainfall
Figure 2 Presents [Reddy, 2008 & 2021]:
Figure 2 Presents [Reddy, 2008 & 2021]:
- Left Side: monthly number of depressions, cyclones & severe cyclones recorded during 1891-1990 in Bay of Bengal & Right Side bottom: the same for Arabian Sea
- Right Side top: natural variability in annual cyclonic storms in Bay of Bengal during 1945-2000
- Left Side: 1871-1990 monthly mean rainfall over Coastal Andhra and Telangana met sub-divisions.
October and November rainfall is highly variable with respect to occurrence and non-occurrence of cyclones – depressions are lower in number -- in Coastal Andhra met-sub-division and in Telangana met sub-division the highest rainfall occurred in July. During the southwest monsoon season very few severe cyclonic storms occurred but defined by depressions reaching as high as 160 per month with occasional occurrence of cyclonic storms. Maximum numbers of severe cyclones were recorded in May [summer] and November [winter]. During August and September cyclones were very few but they are the highest for depressions in Bay of Bengal.
Role of Data Selection on Rainfall & River Water Flows
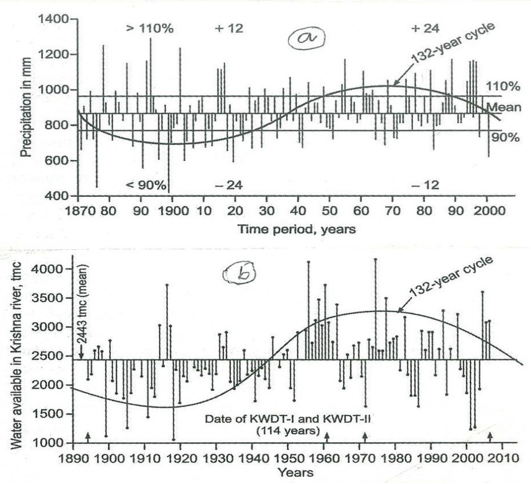
Figure 3: (a) Annual average rainfall of Andhra Pradesh during 1871-72 to 2000/01 & (b) Water availability in Krishna River during 1894-95 to 2007-08.
The importance of data selection is presented with reference to Krishna River. The annual march of Andhra Pradesh mean annual rainfall [mean of the three met sub-divisions, namely Coastal Andhra, Rayalaseema & Telangana is presented in Figure 3a – data source: Parthasarathy, et al. (1995) --,. It presented 132 year cyclic pattern (Reddy, 2016). The mean annual water availability in river Krishna -- data sources: Bachawat Tribunal Award & Brijesh Kumar Tribunal Award -- followed the same 132 year cycle (Figure 3b). It is clear from this that the selection of data series play an important role if the data series that follows rhythmic or cyclic variation. Some such scenarios are discussed with reference to rainfall data selection at all India level and Andhra Pradesh state level. For example, Central Water Commission used the rainfall data of 30-years [1985-86 to 2014-15] for the estimation of water availability in Indian rivers. They argued that IMD using 30 years for computation of climatic normals of met parameters. They have no knowledge on this concept of IMD. WMO proposed this for inter-comparison of data of the world and regions in a country. At the same time it is not fixed. The period changes as time progresses. For example, first the met services prepared normal books for their countries using the data of 1931-60. Later this was for 1961-90. Next will be for 1991-2020 WMO (1966). Water availability in Krishna River:
- Bachawat Tribunal used 1894-95 to 1971-72 [78 years] water availability observed data of Krishna River. The mean of the data set is 2393 tmc ft. This is available at 43% probability level – negatively skewed data set
- Brijesh Kumar Tribunal used 1961-62 to 2007-08 [47 years] water availability observed data in Krishna River. The mean of the data set is 2578 tmc ft. This is available at 58% probability level – positively skewed data set
- For the combined data set of 1894-95 to 2007-08 (114 years], the mean is 2443 tmc ft available at 48% probability level – nearly normally distributed data set
- From Brijesh Kumar Tribunal 1981-82 to 2006-07 [26 years] data set presented a mean of 2400 tmc ft available at 50% probability level – normally distributed data set
- Central Water Commission [CWC] used 1985-86 to 2014-15 [30 years] data [estimated using a model]. The mean water availability estimate is 3144 tmc ft. This is available at 50% probability level – normally distributed data set [similar to the above 26 years data set]
The estimates must be unbiased, that means it should follow normal distribution, that means mean and median [50% probability] should coincide, that means on either side of the mean equal number of years must fall. In the above in the case of:
- In Bachawat 7% values [50% - 43%] are on lower side, that is biased towards lower values and thus it is negatively skewed data set
- In Brijesh Kumar 8% [58%-50%], on upper side, that is biased towards higher values and thus it is positively skewed data set
- Thus the means are presented respectively lower [2393 tmc ft] and higher [2578 tmc ft] values;
- By joining the two data series it is nearly normal [50%-48%] and even the short period of 26 years data set also present normal distribution
- Both showed nearly the same means, namely 2443 tmc ft and 2400 tmc ft
- However the 30 year period data set of CWC also followed normal distribution similar to 26-years data set; but CWC mean is nearly 30% higher than that that of 114 and 26 year normal data sets, as the method used for the estimation of water flow in the river present overestimates as the model underestimates evapotranspiration and thus runoff presents the overestimates; however the other four data sets are observed flows. [See for more details: Reddy (2016, 2019a)].
Role of Few Factors on “Water Availability in Godavari River”
Introduction
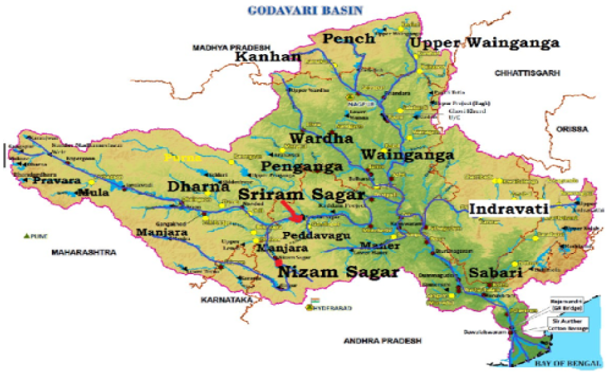
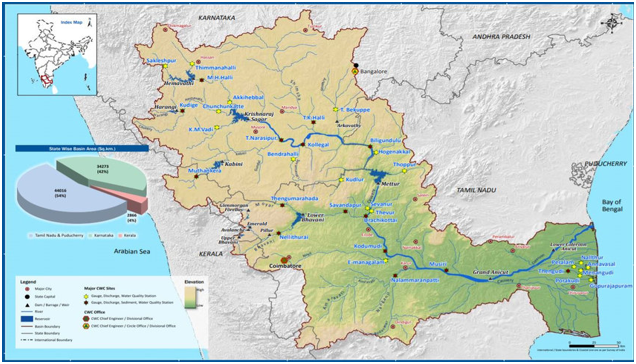
The Godavari River is the largest river in Peninsular India. The Godavari River has a drainage area of 3, 12, 812 sq.km. Figure 4a presents Hydrological observation stations in Godavari River drainage area. Figure 4b presents the Cauvery River Basin.
Introduction
The Godavari River is the largest river in Peninsular India. The Godavari River has a drainage area of 3, 12, 812 sq.km. Figure 4a presents Hydrological observation stations in Godavari River drainage area. Figure 4b presents the Cauvery River Basin.
Role of Rhythmic Variations in Rainfall
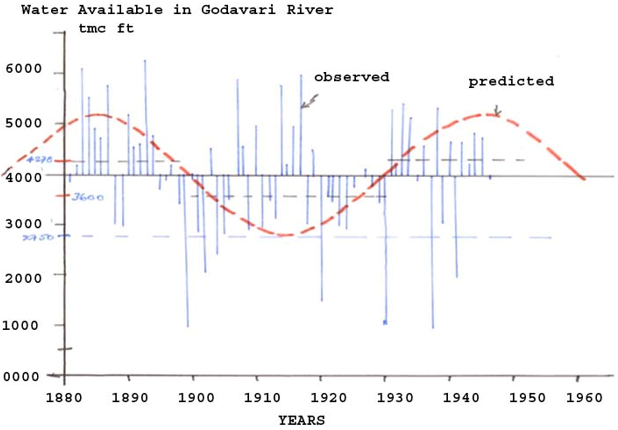
Reddy (2019a) presented the relationship between the all-Indian annual average rainfall 60-year cycle with river water flows [North Western Rivers, Brahmaputra River & Godavari River]. Figure 5 presents the annual water flows in Godavari River during 1881 to 1946 [66 years period with one year data missing] along with 60-year cycle from Figure 1. This data set was taken from Bachawat Tribunal Award. This followed Figure 1 pattern (60-year cycle). Though the data presented 60 year period it presented zero trend as the central 30-years form below the average; and on either side of this period is above the average periods, wherein 36 years were divided in to 16 and 20 years. The mean of 65 years is 3977.71 tmc ft and the averages of below the average and above the average periods are 3613.79 and 4270.86 tmc ft, respectively with a range of 657.07 tmc ft. The lowest values were received at Dawaleswaram (tmc ft): 459 in 1899, 958 in 1920, 286 in 1930 & 400 in 1937 -- by this period projects were not built.
Reddy (2019a) presented the relationship between the all-Indian annual average rainfall 60-year cycle with river water flows [North Western Rivers, Brahmaputra River & Godavari River]. Figure 5 presents the annual water flows in Godavari River during 1881 to 1946 [66 years period with one year data missing] along with 60-year cycle from Figure 1. This data set was taken from Bachawat Tribunal Award. This followed Figure 1 pattern (60-year cycle). Though the data presented 60 year period it presented zero trend as the central 30-years form below the average; and on either side of this period is above the average periods, wherein 36 years were divided in to 16 and 20 years. The mean of 65 years is 3977.71 tmc ft and the averages of below the average and above the average periods are 3613.79 and 4270.86 tmc ft, respectively with a range of 657.07 tmc ft. The lowest values were received at Dawaleswaram (tmc ft): 459 in 1899, 958 in 1920, 286 in 1930 & 400 in 1937 -- by this period projects were not built.
With the mean of 3978 tmc ft, the lowest observed was around 1000 tmc ft in around 3 years and less than 2750 tmc ft in nine years; more than 6000 tmc ft was recorded in two years. That means the variability is from around 1000 tmc ft to around 6000 tmc ft. 2750 tmc ft was taken as total dependable water for distribution among the riparian states. As carryover is not feasible in AP [undivided] in Godavari Basin, like that in the Krishna River, Bachawat has chosen the sum of 90% probability level water availability [2250 tmc ft] plus water in use [500 tmc ft] as dependable water. Bachawat Tribunal allocated 1486.155 tmc ft from the dependable water of 2750 tmc ft for undivided AP. In this 313.155 tmc ft was return flows. That means it allocated 1173 tmc ft wherein 196.387 tmc ft comes from minor irrigation sources [locally available water]. These are divided among AP and TS as follows (Table 3). After deducting the localized contributions like return flows component, minor irrigation component & groundwater component, the water available in Godavari river was 934.6 tmc ft and of which TS gets 554.5 tmc ft and AP gets 380.1 tmc ft to AP plus flood water as it being a lower riparian state – major part goes in to the Sea.
| Parameter | TMC ft | ||
| Total | TS | AP+Hydro-power | |
| Allocated water | 1486.155 | 912.250 | 509.546+64.389=573.935 |
| % Share | 100% | 61.4% | 34.3%+ 4.3% =38.6% |
| Return flows | -313.155 | -192.277 | -107.412 - 13.466=-120.878 |
| Water availability in minor | -196.387 | -165.447 | -30.940 |
| Irrigation sources [locally available] | |||
| Groundwater | -42.013 | -42.013 | |
| Water availability in the river | +934.6 | 554.5 | 380.1 |
Table 3: Sharing of water allocated to undivided AP by AP and TS.
CWC presented two data sets, namely (1) in 1993 the observed flows at Polavaram during 1967-68 to 1984-85 [in below the average cycle period – Figure 1], wherein the average of this data set is 3903.68 tmc ft; and (2) the joint report of NRSC and CWC titled “Assessment of water resources at basin scale using space input” of December 2011 for 1990-91 to 2007-08 [above the average cycle period – Figure 1] the average of this data set is 3993.74 tmc ft; & value at 75% probability level is 3121.46 tmc ft. The same for the Bachawat is 2750 tmc ft [for full cycle]. The difference is 3121.46 – 2750 = 371.46 tmc ft [13.5% of 2750 tmc ft]. CWC estimates appears to be inaccurate, though the average shows nearly the same with that of Bachawat, basically because a report showed high flows in to the Sea during 1990 to 2019 in the month of August on many years [1990, 2006, 2010, 2013 & 2019].
| River* | TMC FT | |||||
| Lowest | 75% | 50% | 25% | 25%-75% | Highest | |
| Sabari | 207.4 | 470 | 540 | 690 | 220 | 0858.9 |
| Indr?vati | 371.8 | 590 | 750 | 1110 | 520 | 1694.5 |
| Pranahita | 427.9 | 740 | 1110 | 1360 | 620 | 3008.3 |
| Polavaram | 1024.9 | 2060 | 2860 | 3540 | 148 | 6492.3 |
*These refer to above average period; may be less by around 15% during below the average Table 4: Water availability under different probability levels for four Rivers.
During the above the average rainfall period [1990-91 to 2017-18], water availability between probability levels 25% and 75% presented a simple linear increase. The slope of the linear curve is the lowest for Sabari and the highest for Godavari River. Close to Sabari is Indr?vati and Pranahita is close to Indr?vati [Table 4]. From the above, these figures will be lower by around 15% during below the average rainfall 30-year period. In the case of river Indr?vati the highest and the lowest water availability during 1990-91 to 2017-18 was 1694.5 and 371.8 tmc ft respectively – during above the average rainfall period (1987/88 to 2016/17 – Figure 1). The 75% value is 590 tmc ft. The water availability statistics under the three data sets is presented in Table 5. It presents the estimates based on Bachawat and CWC.
| Cycle part | Method, TMC FT | ||
| Bachawat | CWC | CWC - Bachawat | |
| Below the average | 3613.79 | 3903.68 | + 289.89 |
| Average | 3977.71 | 3948.71 | - 029.00 |
| Above the average | 4270.86 | 3993.74 | - 277.12 |
| Difference (above – below) | 657.07 | 90.06 | -566.99 |
| Value at 75% Probability | 2750.00 | 3121.46* | -371.46 |
Table 5: The differences between Bachawat and CWC estimates.
Role of ENSO Activity
We have seen under natural rhythmic variability that all-India annual average rainfall of June to May has shown a direct relation with water flows in Godavari River (Figure 5). Figure 6 presents the anomaly of all-India Summer [south west] Monsoon [June to September] Rainfall for 1871-2009 (Reddy, 2000) – it followed 60-year cycle similar to all-India average rainfall. Vertical lines represent rainfall anomalies [red below the average and green above the average]. Circles on the vertical lines represent El Nino years with red colour and La Nina years with green colour.
We have seen under natural rhythmic variability that all-India annual average rainfall of June to May has shown a direct relation with water flows in Godavari River (Figure 5). Figure 6 presents the anomaly of all-India Summer [south west] Monsoon [June to September] Rainfall for 1871-2009 (Reddy, 2000) – it followed 60-year cycle similar to all-India average rainfall. Vertical lines represent rainfall anomalies [red below the average and green above the average]. Circles on the vertical lines represent El Nino years with red colour and La Nina years with green colour.
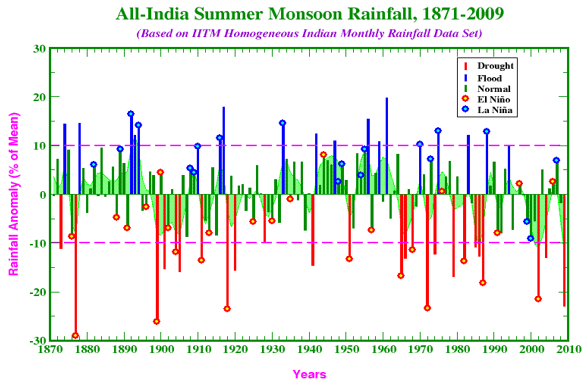
Figure 6: Yearly March of All-India Annual Rainfall with El Nino [Red circles] and La Nina years [green circles].
Table 6 presents the number of years in each 30 years period [below and above the average parts of 60 year cycle] occurred EL Nino (red circle) and La Nina (green circles) taken from Figure 6.
| 30 year period (Number of years) | El Nino & La Nina years in each 30 year periods | ||
| Below (-) /above (+)* | El Nino | La Nina | |
| 1867/68 – 1896/97 | + | 4 | 4 |
| 1897/98 – 1926/27 | - | 6+1 | 4 |
| 1927/28 – 1856/57 | + | 4+1 | 3 |
| 1957/58 – 1986/87 | - | 4+1 | 3 |
| 1987/88 -- 2016/17 | + | 3+2 | 2+2 |
Table 6: El Nino and La Nina years in each 30 years segment of Figure 8.
From Figure 6 & Table 6, it is seen that:
- In 9 La Nina years received > 110% of average rainfall
- In 12 El Nino years received < 90% of average rainfall & in 5 El Nino years received < 80% of average rainfall
- During below the average 60 year cycle 4 to 6 years received deficit rainfall in 3 to 4 years received surplus water
- During above the average 60-year cycle 2 to 4 years received surplus rainfall and in 4 to 5 years received deficit rainfall
Here the important point is:
- During below the average rainfall cycle, El Nino will increase the deficit in rainfall
- During above the average rainfall cycle, La Nina will increase the surplus rainfall
- During above the average rainfall cycle, El Nino year showed deficit rainfall and thus we expect lower water flows in Godavari River.
- During below the average cycle, La Nina year presents surplus water and thus expect higher water availability in Godavari River.
That means ENSO alone don’t explain the yearly rainfall for the forecasting. By joining ENSO with natural variability in rainfall might give better results in the long range forecasts of All-India SWM rainfall, which is 87% of annual rainfall.
Role of cyclonic Activity
Godavari River basin is influenced by cyclonic activity principally in Bay of Bengal, that too lower part of the river basin. Major share of water on those days enters in to the Sea – to avoid damage to dam/barrage. Severe cyclonic storms occur in October November {post-monsoon season] and April [pre-monsoon season]. Southwest Monsoon [June to September] the rainfall is in opposite pattern to Northeast Monsoon [October to December] following 56-year cycle – Figure 7.
Godavari River basin is influenced by cyclonic activity principally in Bay of Bengal, that too lower part of the river basin. Major share of water on those days enters in to the Sea – to avoid damage to dam/barrage. Severe cyclonic storms occur in October November {post-monsoon season] and April [pre-monsoon season]. Southwest Monsoon [June to September] the rainfall is in opposite pattern to Northeast Monsoon [October to December] following 56-year cycle – Figure 7.
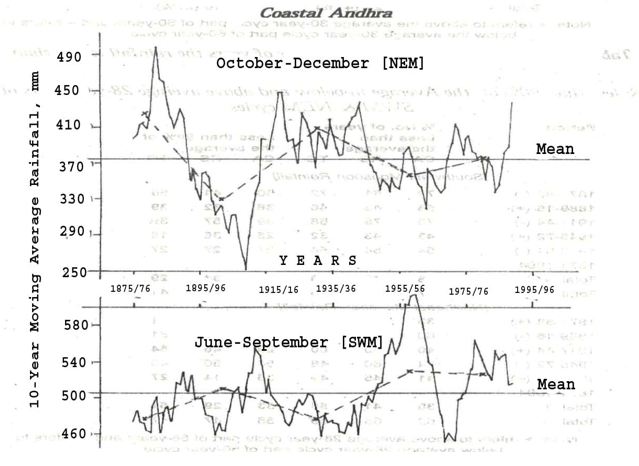
Figure 7: Coastal Andhra Met Sub-division annual average rainfall of (a) southwest monsoon [June-September] and (b) northeast monsoon [October – December].
Figure 2 top right pattern follows the southwest monsoon pattern of Coastal Andhra (Figure 7). It is seen from Figure 7 that during the 1st cycle SWM presented extreme rainfall condition with less variation in NEM. This is reversed in the 2nd cycle – that is, during SWM little variation in rainfall with extreme variations in NEM.
Role of Data Selection
Role of Data Selection
As advocated by CWC, if we select 30 years data set in Figure 5, there are four conditions dealt in the above 4 sections. They are as follows:
In the 65 years:
- If selected data set forms below the average part of 30 years, the average is 3613.79 tmc ft
- If selected data set forms above the average part of 30 years, the average is 4270.86 tmc ft
- If the selected data set forms 30 years left of centre point, the average is 4064 tmc ft
- If the selected data set forms 30 years right of centre point, the average is 3829 tmc ft
Linking of Godavari River with Krishna River
On 17th February 2022 NWDA held a meeting with AP, TS, Karnataka, Tamil Nadu (TN) & Pondicherry to discuss the issue of linking Godavari with Cauvery via Krishna and Penna Rivers. Already Krishna is partially linked with Penna & Chennai drinking water through Telugu Ganga Project. Bachawat Tribunal allocated 15 tmc ft to Chennai for drinking water.
On 17th February 2022 NWDA held a meeting with AP, TS, Karnataka, Tamil Nadu (TN) & Pondicherry to discuss the issue of linking Godavari with Cauvery via Krishna and Penna Rivers. Already Krishna is partially linked with Penna & Chennai drinking water through Telugu Ganga Project. Bachawat Tribunal allocated 15 tmc ft to Chennai for drinking water.
After several proposals, now NWDA proposed to distribute 247 tmc ft among the states as follows: AP, TS, TN, Karnataka & Pondicherry respectively 90, 80, 45, 25 & 5 through Inchampalli to Nagarjunasagar. Even though AP is the lower riparian state from where the linking must start, a TS expert is working as an advisor [BJP leader] to NWDA is pushing hard the interlinking from Inchampalli in TS. To get justice, he must be moved away from the interlinking projects that includes AP & TS. Why I said this is already TS creating problems to AP on using surplus water under Krishna River by building illegal projects to use nearly double to that allocated to TS and producing power even under below dead storage level and did not heed to orders from the central committee to stop as AP use water from level 854 ft from Pothireddypadu head regulator.
If linking starts in TS, the same thing will happen even under Godavari both in terms of allocated and surplus water as the TS government wants more water for real estate activity and as well as drinking water as more districts were created and Hyderabad is being expanded far and wide – more than 50% of drinking water supply is presently going as waste, that is used for irrigation to produce polluted food. Also, locally available drinking water bodies were considered redundant by the government, which was announced by the state’s chief minister at 2022-23 state budget sessions. – Following the 1908 severe floods to river Musi that passes through the City of Hyderabad, caused 10,000 deaths and huge property loss. On the advice of the legendary Engineer, Sir, Mokshagundam Visweswarayya. Constructed Osmansagar (1913-1918) on the river Musi and Himayatsagar (1920-1927) on Easi, a tributary to Musi River to contain future floods and to provide drinking water to twin cities, spread over 10,000 acres. Since 1930 this water is used for drinking. Later governments noticed affecting the quantity and quality of flows in to the two lakes. To address them, governments issued a series of GOs. The first one in 1989, the 2nd one in 1994 and 3rd one by integrating first two as GO111 was issued in 1996. Yet violations were rampant. I myself filed a PIL in AP High Court in 2007. As the area covers 134,600 acres, modern greedy men looking it as prime land for real estate ventures. On March 15, 2022 CM of TS state KCR stated that “GO111 has now become redundant as Hyderabad no longer depends on the two reservoirs for water its requirements”. For real estate ventures the government wanted to kill them and bring water from faraway places at huge cost. Parents nurture their young and make them to live on their own. This does not mean parents are redundant!!! We are wasting existing water resources and running after new sources.
On the above mentioned NWDA meeting, AP said the interlinking must be from Polavaram and that to only if there is surplus water. Polavaram project was proposed by the Bachawat Tribunal. The 174-km long Polavaram right canal meant to connect with the Krishna River.
TDP government in AP initiated Pattiseema lift irrigation to show that he is the first to link Godavari with Krishna. The Pattiseema project lifts flood waters from the Godavari when it flow over 15 meters height at Tadipudi, and transports it over four kilometres to the Polavaram right canal. This forms the surplus water expected to go in to the Sea as upstream projects are not fully operative. The objective of this lift was to use water under the disguise of linking rivers for real estate ventures to be under taken at Amaravati, the proposed new AP Capital – not started building as such the capital but built poor quality temporary structures – sinking, leaking, etc. — and helped to raise the cost of land values around it. With this for two years neglected the construction of Polavaram and thus helped escalation of cost. The present government planned to establish administrative capital at Visakhapatnam – the water from the left canal from Polavaram provides the drinking water to Visakhapatnam [as planned originally from allocated water].
A lift irrigation scheme was planned during Dr. YSR time to bring 170 mgd of Godavari water to Hyderabad to meet the drinking water needs. The 1st phase of water was expected to reach Hyderabad by November 2015 – now it is in use.
Himanshu Thakkar of SANDRP presented a report titled “Godavari Krishna Rivers linking: Are we celebrating an illegal, unnecessary & misconceived water transfer project”. In this report started with “The national media seems to be celebrating linking of Godavari and Krishna Rivers in Andhra Pradesh on September 16, 2015 as the first major step towards interlinking of Rivers in India.
TS expressed the need to assess surplus water in Godavari River before interlinking of Godavari with Cauvery. The average water availability in Godavari River Basin is around 3950 tmc ft. However, the extremes go as high as 6000 tmc ft and as low as 1000 tmc ft. The water distributed to riparian states at 75% probability level is 2750 tmc ft. That means the difference between mean and dependable water is 1200 tmc ft.
For assessing the surplus and deficit water condition hither to no realistic approach was proposed. The following three factors must be taken in to account on yearly basis:
- Annual water flows in Godavari River follow the 60-year cycle seen in all-India annual & southwest monsoon average rainfall. It is known as natural rhythmic variation, a main component of climate change;
- During below the average rhythmic period in rainfall, if El Nino occurs drought conditions intensifies;
- During above the average rhythmic period in rainfall, if a severe cyclonic storm occurs it creates severe surplus water condition; and thus large part of it goes in to the Sea to safeguard the dams. This does not come under surplus water availability
In addition to these, the major component is data set selection. It should be normally distributed with Mean = median, if the data series follow rhythmic variation.
Summary & Conclusions
With the increasing water demand with the progression of time, it is essential to bring water from excess regions to deficit regions. However, this requires proper scientific assessment of water resources in the rivers in those regions. However, some state governments have expressed their unwillingness to share water from rivers from those states – for example Rivers originating from Himalayan zones like Ganga, Mahanadi from Odisha, and Indr?vati from Chhattisgarh by saying “no surplus water”.
With the increasing water demand with the progression of time, it is essential to bring water from excess regions to deficit regions. However, this requires proper scientific assessment of water resources in the rivers in those regions. However, some state governments have expressed their unwillingness to share water from rivers from those states – for example Rivers originating from Himalayan zones like Ganga, Mahanadi from Odisha, and Indr?vati from Chhattisgarh by saying “no surplus water”.
In assessing the surplus water availability or deficit water availability in a given river, government agencies must take in to account natural variability in rainfall. Also, year by year impact on rainfall and thus on water flows in to Godavari, such as cyclonic activity in Bay of Bengal and ENSO [El Nino & la Nina]: (a) Godavari annual flows showed 60-year cyclic variations similar to all-India annual average rainfall of June to May. The difference in means of the above and below average parts of cycle presented 600 tmc ft; (b) El Nino occurrence during below the average part of the cycle amplifies the dry condition; & (c) Severe cyclonic storms during pre- & post-monsoon seasons in Bay of Bengal cause severe floods wherein major part must be released in to the Arabian Sea and thus this does not come under surplus water.
The other most important factor is selection of data set for assessing water availability in any river: (a) The mean river water flows showed large differences based on the selected data; & (b) It should be normally distributed with Mean = median.
Another important factor is selection of right site for execution of interlinking process. The site of interlinking must be in lower riparian state and not in upper riparian state: (a) NDWA proposed the Inchampalli in TS, as one of the advisor to NWDA in this process is from TS. In this water has to be lifted at huge cost; & (b) Bachawat Tribunal proposed and approved Polavaram Dam right canal for taking Godavari water through gravity and join the Krishna River at Vijayawada. Right canal is already completed to carry through gravity for proposed 80 tmc ft.
Acknowledgement
The research is self-financed. The author expresses his grateful thanks to those authors whose work was used for the continuity of the story. The author also confirms there is no conflict of interest involve with any parties in this research study.
The research is self-financed. The author expresses his grateful thanks to those authors whose work was used for the continuity of the story. The author also confirms there is no conflict of interest involve with any parties in this research study.
References
- Parthasarathy, B., Munot, A.A. & Kothawale, D.R., (1995). Monthly and seasonal rainfall series for all-India homogeneous regions and meteorological subdivisions: 1871-1994. IITM, Pune [ISSN 0252-1075], 113p.
- Reddy, S.J., (2000). Andhra Pradesh Agriculture Scenario of the last four decades. Hyderabad, 105p.
- Reddy, S.J., (1993). Agroclimatic/Agrometeorological Techniques: As applicable to Dry-land Agriculrure in Developing Countries., www.Scribd.com/Google Books, 205p; Book Review appeared in Agriciltural and Forest Meteorology, 67:325-327 (1994).
- Reddy, S.J., (2008). Climate Change: Myths & Realities. www.scribd.com/Google Books, 176p.
- Reddy, S.J., (2016). Irrigation and Irrigation Projects in India: Tribunals, Disputes and Water Wars Perspective. B.S. Publication, Hyderabad, 123p.
- Reddy, S.J., (2017). GO111: Protecting Water Resources of Hyderabad. Proc. 4th NCWES, B. S. Publication, Hyderabad, pp.432-436.
- Reddy, S.J., (2019a). Water Resources Availability in India. Brillion Publishing, New Delhi, 224.
- Reddy, S.J., (2019b). Agroclimatic/Agrometeorological Techniques: As applicable to Dry-land Agriculrure in Developing Countries (2nd Edition with the same title). Brillion Publishing, New Delhi, 372p.
- Reddy, S.J., (2021). Disturbances Recorded in Bay of Bengal & Arabian Sea: A Note. J. Agric. Aquac., 3(2):14p.
- WMO [World Meteorological Organization], (1966). Climate Change. Geneva, Switzerland, WMO Tech Note 79, WMO, 195 TP 100, pp. 81, (Prepared by J.M. Mitchel, B. Dzerdzeevskii, H. Flohn, W.L. Hofmeyer, HH. Lamb, K.N. Rao.
Citation: S. Jeevananda Reddy. (2022). A Note on Interlinking of Rivers: An Indian Example [Part-III]. Journal of Agriculture and Aquaculture 4(3).
Copyright: © 2022 S. Jeevananda Reddy. This is an open-access article distributed under the terms of the Creative Commons Attribution License, which permits unrestricted use, distribution, and reproduction in any medium, provided the original author and source are credited.

