Research Article
Volume 3 Issue 2 - 2021
Disturbances Recorded in Bay of Bengal & Arabian Sea: A Note
Formerly Chief Technical Advisor – WMO/UN & Expert – FAO/UN Fellow, Telangana Academy of Sciences [Founder Member] Convenor, Forum for a Sustainable Environment Hyderabad, TS, India
*Corresponding Author: S. Jeevananda Reddy, Formerly Chief Technical Advisor – WMO/UN & Expert – FAO/UN Fellow, Telangana Academy of Sciences [Founder Member] Convenor, Forum for a Sustainable Environment Hyderabad, TS, India
Received: October 21, 2021; Published: November 04, 2021
Abstract
Rainfall at any given place or region depends upon not only on weather conditions but also on localized “climate Systems” and their role on circulation patterns. Under the weather systems, low pressure systems play important role in getting widespread rainfall in east and west coastal zones and adjoining regions. Low pressure systems reaching cyclonic level are principally seen in pre- & post-monsoon seasons. That is in summer and winter pereiods. They are prominent over Bay of Bengal relative to Arabian Sea in number and intensity. Because of this the rainfall over the coast and inland zones present conspicuously large differences. These are clearly seen in three meteorological Sub-divisions of United Andhra Pradesh [Coastal Andhra, Rayalaseema & Telangana] in terms of contribution from southwest and northeast monsoons seasons. In the case of southwest monsoon season low pressure systems reaching deep depressions play the major role on rainfall. While making planning for agriculture and water resources, these must be taken in to account. However, with the unabated population growth, human interference changes its impact on nature; and on the contrarily international agencies are misleading these and patronizing psuedo global warming.
Keywords: Cyclones; Climate change; Rainfall; Temperature; Urban floods; Trees plantation
Introduction
The scientific community around the world to serve their vested interests such as to get promotions or get funds for the survival research or institutions where they serve. We never look at why former President Trump, a Republican, of USA opposed the IPCC’s concept of climate change and decided not to waste public funds on IPCC, and why democratic leaders including the present President Biden not only supporting IPCC’s concept and allocating trillions of dollars as funds. it is quite natural as IPCC is their baby. It is natural denounce Trump and praise Biden. This is the way of life around the world that runs around the “Money” by killing the “Science”, not only in the sphere of climate change but also every sphere of science. For example Genetically modified seeds. The seed is monopolised by one multinational company. Unlike traditional seed, the life of GM seed is short lived and creating new pests/diseases that severely affecting neighbouring farmers and causing farmers suicides in those belts. Yet IPCC’s climate change is more hazardous as it is killing the basic science of meteorology & Oceonography and thus agroclimatology and agrometeorology. Though we have wealth of accumulated observed meteorological data series of more than 100 years for temperature and rainfall we rarely look at them as this needs scientific knowledge (Reddy, 1993, 2002 & 2019a&b). Half the 2021 Nober Prize under Physics received two who are octogenerians with the global warming bent. While awarding the award the committee failed to look in to the facts of IPCC & Al Gore who received Nobel Prize in 2007 for similar issue “man-made climate change” and withdrew some of the conclusions they made in their reports based on which they received the award.
In the past local people built proverbs to help farmers on weather and climate in terms of temperature versus seasons and rainfall which is still to date works. They presented easily understandable way in books that help even commonman on the street through vocal transmissions. Now, the concept lost in the din with modern agriculture and migration of rural population to urban areas for greener pastures. Thus they lost the traditional widom.
Unfortunately this is not stopped here but the modern media and psuedo exerts have been mis-leading the public and rulers on weather and climate with their half-baked knowledge on the subjects such as “occurrences of disturbances in Bay of Bengal and Arabian Sea and associated rainfall in the two Telugu States”. To create sensation they try to bring in global warming, a word which has no meaning in real terms. To provide the realistic picture, the writer tried to present factual information through the observed data on these issues. However, with unabated population growth, human interference changes its impact on nature. This is playing major role in urban India. Rainfall at any given place or region depends upon not only on weather conditions but also on localized “climate Systems” and their role on circulation patterns. Climate system consists of five major components, namely the atmosphere, the hydrosphere, the cryosphere, land surface, the biosphere. The climate system is continuously changing due to the interactions between the components as well as external factors such as volcanic eruptions or solar variations and human-induced factors such as changes to the atmosphere and changes to land use. The atmosphere is not an isolated system. It interacts with other components of the Earth system – the Oceans, for example. But it is also in contact with the cryosphere [ice and snow], the biosphere [animals and plants], the pedosphere [soil] and the lithosphere [rocks]. All these elements together compose the climate system, whose divided components and processes are connected and influence each other in diverse ways [Reddy, 2016, 2019a, 2021a&b]. We need to re-evaluate development projects. For example in Himalayan zones in India wherein the terrain is fragile that cause severe damage to not only to nature but also tmo people living in those regions.
Cyclones in Arabian Sea & Bay of Bengal
Introduction
Definition of cyclone: A cyclone is a huge strong wind system that blows around the centre of an intense low-pressure area. Cyclones are the local name of. The Indian Ocean and the South Pacific Ocean. But in the Northwest Pacific Ocean, they are known as typhoons and in the Northeast Pacific Ocean and North Atlantic, they are known as hurricanes. Since the cyclones form in the tropical region, they are also known as tropical storms, tropical revolving storms, or tropical cyclones. In the northern hemisphere, cyclone winds blow anticlockwise and they reverse in the southern hemisphere.
Cyclones develop over warm seas near the equator. Air heated by the sun rises very swiftly, which creates areas of very low pressure. As the warm air rises, it becomes loaded with moisture which condenses into massive thunder clouds. Surrounding air rushes in to fill the void that is left. But because of the constant turning of the Earth on its axis, the air is bent inwards and then spiral upwards. The swirling winds rotate faster and faster, forming a huge circle that can be up to 500-1000 km across. At the centre of the storm is a calm, cloudless area called the eye – where there is no rain, and the winds are fair.
Naming cyclone storms: During World War II weather forecasters took to naming cyclone storms using female names. By 1953, the American weather service had put together a list of names (from alphabets A to W) that were used to name the storms that formed. By the late 1970s this list grew to include male and female names. Compared to the system of naming storms and hurricanes, naming tropical cyclones is a rather recent convention. By the year 2004, eight countries located in the Indian Ocean region agreed upon a naming convention that could help identify tropical cyclones affecting the region. Bangladesh, India, Maldives, Myanmar, Oman, Pakistan, Sri Lanka, and Thailand agreed to contribute a list of names each thus developing a pool of names. Cyclones developing in the region are now named sequentially from this pool.
Classification criteria of low pressure systems: Table 1 presents the criteria followed by the India Meteorological Department [IMD] to classify the low pressure systems in the Bay of Bengal and the Arabian Sea as adopted by World Meteorological Organization [WMO].
| Type | Wind Speed | |
| Knots | KMPH | |
| Low Pressure Area | < 17 | < 31 |
| Depression | 17-27 | 31-39 |
| Deep Depression | 28-33 | 50-61 |
| Cyclonic storm | 34-47 | 62-88 |
| Severe Cyclonic storm | 48-63 | 89-117 |
| Very Severe cyclonic storm | 64-90 | 118-167 |
| Extremely severe cyclonic storm | 91-119 | 168-221 |
| Super cyclonic storm | >120 | >222 |
Table 1: Criteria followed by IMD to classify low pressure Systems.
IMD published the results of a study conducted on some 96 districts of the country. Among these, about 72 are coastal districts while the rest are close to the coastline; 12 districts of the country stand to be affected most by cyclones, and these districts are classified as “very highly prone”, which are in the eastern coastal belt, namely these include Yanam district in Puducherry, East Godavari, Krishna, and Nellore districts in Andhra Pradesh, Balasore, Bhadrak, Jagatsinghpur, and Kendrapara districts in Odisha, Medinipur, Kolkata, and North and South 24 Parganas in West Bengal. Apart from these there are about 41 districts which are classified as “highly prone”. 30 districts are “moderately prone” and the remaining 13 are “less prone”.
Destructive cyclones that occurred in India as well as it borders: The systematic scientific studies of tropical systems in the Bay of Bengal and Arabian Sea were started during the 19th century by Henry Piddington. Piddington utilised meteorological logs of vessels that navigated the seas and published a series of memoirs, in the Journal of the Asiatic Society of Bengal between 1839 and 1858. These memoirs gave accounts and tracks of individual storms in the Bay of Bengal and the Arabian Sea. Below account is for 1942 to 2008 – see for more details Wikipedia.
- 1942 Bengal Cyclone: hit near the India/Bangladesh border, resulting in around 40,000 fatalities.
- 1960 East Pakistan I Cyclone: claiming 6,000 deaths this cyclone hit the eastern portion of Pakistan on October 10 what was known then as East Bengal State.
- 1963 East Pakistan II Cyclone: on May 23, the cyclone hit present-day Bangladesh (then known as East Pakistan province), causing Twenty-two thousand fatalities due to storm surge and flooding.
- 1965 Pakistani Bengali Cyclones: two cyclones that hit on May 11 and June 1 killed a total of 47,000 people.
- 1965 Pakistani Cyclone: hit near Karachi, Pakistan on December 15, causing about 10,000 casualties.
- 1970 Bhola Cyclone: killed between 300,000 to 500,000- people in East Pakistan (now Bangladesh).
- 1971 Orissa Cyclone: killed around 10,000- people in Cuttack, Orissa, India.
- 1977 Andhra Pradesh Cyclone: killed 10,000-people in Andhra Pradesh, India.
- 1985 Cyclone 01B: on May 25 in Bangladesh, Meghna River Delta a cyclone created a surge 15-20 feet high killing around 6,000 -10,000 people.
- 1988 Cyclone 04B: on November 26 the cyclone hit the Sundarbans part of Bangladesh. Heavy storm surge killed 2000-people (with 6000-missing). Besides, the storm caused1000 fatalities in Malaysia, Thailand, and western Indonesia.
- 1991 Bangladesh Cyclone: killed 138,000-people in the Chittagong region of Bangladesh.
- 1999 Orissa Cyclone: killed around 10,000-people in the Orissa state of India.
- 2007 Cyclone Sidr: struck Bangladesh on 15 November, and killed at least 3,500 people.
- 2008 Cyclone Nargis: struck the Ayeyarwady Delta in Myanmar killing over 130,000-people and devastating the country’s largest city, Yangon, making it Myanmar’s deadliest natural disaster in history, the costliest North Indian cyclone on record, and the second deadliest North Indian cyclone in recorded history.
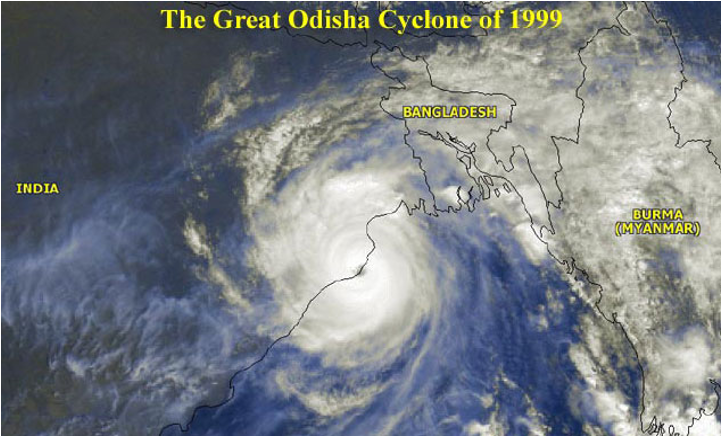
In the recorded history of cyclones for the State of Orissa, the Super Cyclone of 29-30 October, 1999 was undoubtedly the most intense one [Figure 1]. It had some unique features such as rapid intensification, small radius of eyewall confining the large surge close to the point of landfall and relatively long life after landfall. Climatologically there is a high frequency of dissipation of cyclones in October because of strong easterly winds aloft. Cyclogenesis usually terminates at the stage of marginal cyclones. Occasionally development of cyclones to hurricane force winds and higher occurs in September and October as it happened in 1831 and 1885.
Why September 2021 was a unique weather month for India [Akshit Sangomla, Down To Earth, 05 October 2021]. Most of the month’s rainfall was brought in by a series of five low-pressure areas that formed in the Bay of Bengal. Two of these systems further intensified into a deep depression and a cyclone. Cyclone Gulab formed as a low pressure area on September 24 and quickly intensified into a cyclone by September 25 evening. It moved at a considerable pace over the Bay of Bengal but did not intensify further and made landfall along the north Andhra coast close to Kalingapatnam. It de-intensified into a depression after making landfall and then eventually a low-pressure area, but did not dissipate completely. It had enough strength to trek the entire width of the country, causing rainfall in Odisha, Chhattisgarh, Maharashtra and Gujarat along the way, drop into the Arabian Sea and re-intensify into cyclone Shaheen of significant strength. Cyclone Shaheen further strengthened into a severe cyclone and moved west wards along the Makran coast of Pakistan. However, Akshi Sangomla tried to attribute such system to pictitious global warming. It eventually made landfall in Oman in early hours of October 4. September received: in Gujarat 400.5 mm [268%], Rajasthan 175.3 mm [175%], Haryana 187.5 mm [139%], Delhi 232.1 mm [101%], Maharashtra 350.5 mm [95%], Telangana 290.1 mm [78%], Punjab 143.2 mm [77%], Odisha 384.8 mm [70%].
Cyclonic Activity in Bay of Bengal & Arabian Sea
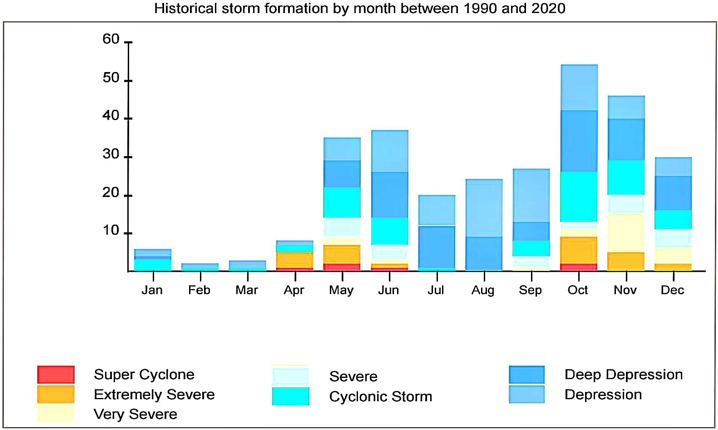
Figure 2a presents the monthly number of Depressions (D), Cyclonic Storms (CS) and Severe Cyclonic Storms (SCS) in Bay of Bengal [left figure] and Arabian Sea [right bottom figure] – Figure 2b presents the data of 1990-2020. Left figure also includes monthly average [1871-1990] rainfall in mm and Coefficient of Variations (CV, %)) for Coastal Andhra (CA) and Telangana State (TS). Right top figure presents the natural variability in number of cyclones per year during 1945 to 2000 (Reddy, 2008). Natural Variability in Bay of Bengal cyclonic storms: The right top figure in Figure 2a presents the natural variability in number of cyclones per year in Bay of Bengal during 1945 to 2000 during May to November (Reddy, 2008). They followed the 56-year cycle as that of Coastal Andhra Southwest Monsoon rainfall (Figure 3; Reddy, 2000). Above the average 28 year period changes to below the average at 1973. Below the average 28 period ended by 2001 and since 2002 it is in the above the average 28 period. Same is the case with Coastal Andhra Southwest Monsoon Rainfall. During the above the average part of the cycle the number was more than 10 and reaching as high as 16 except in one year wherein it was less than 10; and during the below the average part of the cycle the number was less than 10; mostly around 4 and reaching as low as zero.
Figure 2a presents the monthly number of Depressions (D), Cyclonic Storms (CS) and Severe Cyclonic Storms (SCS) in Bay of Bengal [left figure] and Arabian Sea [right bottom figure] – Figure 2b presents the data of 1990-2020. Left figure also includes monthly average [1871-1990] rainfall in mm and Coefficient of Variations (CV, %)) for Coastal Andhra (CA) and Telangana State (TS). Right top figure presents the natural variability in number of cyclones per year during 1945 to 2000 (Reddy, 2008). Natural Variability in Bay of Bengal cyclonic storms: The right top figure in Figure 2a presents the natural variability in number of cyclones per year in Bay of Bengal during 1945 to 2000 during May to November (Reddy, 2008). They followed the 56-year cycle as that of Coastal Andhra Southwest Monsoon rainfall (Figure 3; Reddy, 2000). Above the average 28 year period changes to below the average at 1973. Below the average 28 period ended by 2001 and since 2002 it is in the above the average 28 period. Same is the case with Coastal Andhra Southwest Monsoon Rainfall. During the above the average part of the cycle the number was more than 10 and reaching as high as 16 except in one year wherein it was less than 10; and during the below the average part of the cycle the number was less than 10; mostly around 4 and reaching as low as zero.
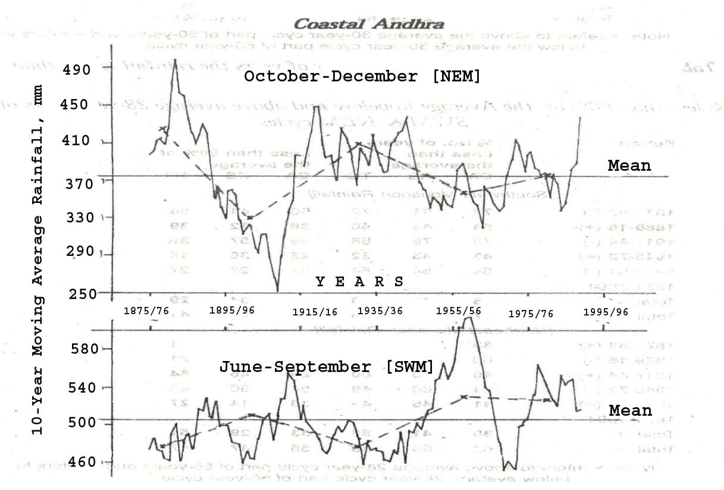
Both the Southwest Monsoon [SWM] and Northeast Monsoon [NEM] rainfall presents a typical pattern. However, SWM rainfall pattern presents clearly the opposite pattern of 56 year cycle pattern of NEM [Figure 3] -- dotted lines represent 56-year cycle in both SWM & NEM [Reddy, 2000]. Table 2 presents the lowest and the highest mean monthly rainfall & corresponding years during 1871-1990 in Coastal Andhra (CA) and Telangana (TS).
In both CA & TS the lowest rainfall was less than 60 mm -- average per month. In the case of CA the highest is more or less the same during July to September with the lowest and the highest values in June and October. In the case of TS, though high rainfall amounts were seen during July to September. June and October showed lower values of the same order.
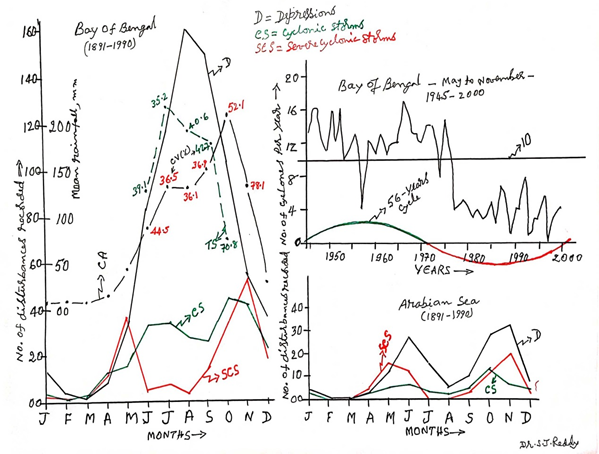
Figure 2a: Number of disturbances [depressions, cyclonic storms & severe cyclonic storms] recorded during 1891-1990 in Bay of Bengal [left figure] and Arabian Sea [right bottom figure]; natural variability in cyclonic storms in Bay of Bengal during 1945-2000 [right top figure]; & mean of 1871-1990 monthly rainfall over Coastal Andhra and Telangana regions
The left figure [Figure 2a] presents monthly rainfall averages of 1871-1990 for Coastal Andhra (CA) and Telangana (TS). For CA July, August & September presented around the same mean and the Coefficient of Variations [CV, %], October presented the highest mean monthly rainfall but C.V increased to 52.1% from 36.9% in September. In the case of November it is 78.1%. That means, the October and November rainfall is highly variable with respect to occurrence and non-occurrence of cyclones – depressions are lower in number. For TS the highest rainfall occurred in July with C.V. of 35.2% with October rainfall showing high variation [CV as high as 70.8%].
| Month | Mean monthly Rainfall during 1871-1990, mm/year | |||
| Coastal Andhra (CA) | Telangana (TS) | |||
| The Lowest | The Highest | The Lowest | The Highest | |
| June | 25.2/1923 | 194.4/1906 | 25.5/1923 | 250.4/1906 & 1938 |
| July | 46.8/1881 | 315.5/1989 | 58.2/1877 | 495.1/1988 |
| August | 28.5/1968 | 275.0/1886 | 38.3/1968 | 405.5/1983 |
| September | 58.7/1907 | 322.9/1964 | 51.1/1896 | 510.7/1908 |
| October | 12.7/1896 | 465.9/1962 | 00.4/1907 | 240.8/1973 |
Table 2: The lowest and the highest rainfall amounts/years during June to October in CA & TS.
In dry-land agriculture point of view the date of onset of the Southwest Monsoon is different from that of the commencement time of planting rains [Reddy, 1993]. The later require threshold limit of rainfall to be satisfied. The onset of the Southwest Monsoon rainfall over Kerala and its advance over the country is of great importance to the economy of the country [Reddy, 2002]. However, the onset and withdrawal of the Southwest Monsoon are highly variable. For example: (a) in the case of Coastal Andhra Pradesh the earliest date/year is 28th May 1925 and the delayed date/year is 24th June 1959; (b) in the case of Telangana and Rayalaseema are 28th May 1925 & 24th June 1959 and 24th May 1933 and 24th June 1959; (c) for Kerala they are 13th May 1967 and 16th June 1932.
Disasters scenario: The left figure [Figure 2a] presents the Bay of Bengal scenario. During the Southwest Monsoon Season very few Severe Cyclonic Storms occurred but defined by Depressions reaching as high as 160 per month with occasional occurrence of Cyclonic Storms. Maximum numbers of Severe Cyclonic Storms were recorded in May [summer] and November [winter]. The right bottom figure presents the Arabian Sea scenario. However this is not the case with reference to Depressions and Cyclonic Storms during the Southwest Monsoon Season; the disturbances did not cross 35 per month during 1891-1990. During August & September cyclones were very few but they are the highest for depressions in Bay of Bengal. August presents a typical pattern: (a) in Arabian Sea all the three are the lowest and (b) in Bay of Bengal Depressions are the highest and Severe Cyclonic Storms are the lowest.
Impact of ENSO on Indian Rainfall
Sir Gilbert Walker discovered the “Southern Oscillation” or large-scale changes in Sea Level Pressure across Indonesia and the tropical Pacific. However, he did not recognize that it was linked to changes in the Pacific Ocean or El Niño. It wasn’t until the late 1960s that Jacob Bjerknes and others realized that the changes in the Ocean and the Atmosphere were connected and the hybrid term “ENSO” was born. It wasn’t until the 1980s or later that the terms La Niña and Neutral gained prominence.
Sir Gilbert Walker discovered the “Southern Oscillation” or large-scale changes in Sea Level Pressure across Indonesia and the tropical Pacific. However, he did not recognize that it was linked to changes in the Pacific Ocean or El Niño. It wasn’t until the late 1960s that Jacob Bjerknes and others realized that the changes in the Ocean and the Atmosphere were connected and the hybrid term “ENSO” was born. It wasn’t until the 1980s or later that the terms La Niña and Neutral gained prominence.
Though ENSO is a single climate phenomenon, thus it has three states, or phases, it can be in. The two opposite phases, “El Niño” and “La Niña,” require certain changes in both the Ocean and the Atmosphere because ENSO is a coupled climate phenomenon. “Neutral” is in the middle of the continuum.
El Niño: A warming of the ocean surface, or above-average Sea Surface Temperatures (SST), in the central and eastern tropical Pacific Ocean. Over Indonesia, rainfall tends to become reduced while rainfall increases over the tropical Pacific Ocean. The low-level surface winds, which normally blow from east to west along the equator (“easterly winds”), instead weaken or, in some cases, start blowing the other direction (from west to east or “westerly winds”).
La Niña: A cooling of the ocean surface, or below-average Sea Surface Temperatures (SST), in the central and eastern tropical Pacific Ocean. Over Indonesia, rainfall tends to increase while rainfall decreases over the central tropical Pacific Ocean. The normal easterly winds along the equator become even stronger.
Neutral: Neither El Niño or La Niña. Often tropical Pacific SSTs are generally close to average. However, there are some instances when the Ocean can look like it is in an El Niño or La Niña state, but the atmosphere is not playing along (or vice versa).
India Meteorological Department issues long-range rainfall forecasts at all India level commenced even before Independence. Sir Gilbert Walker formulated the Basic concept of long-range rainfall forecast. He was Head of the India Meteorological Service from 1904 to 1926, found association between a meteorological element, such as, rainfall and some other variables at an earlier time. El Nino factor is one such variable. Table 3 presents the grouping of 1880-2006 – 126 years – Indian Southwest Monsoon Rainfall with the southern oscillation (SO) events, namely El Nino, La Nina and neutral under deficit [D], below normal (BN), normal (N), above normal (AN) and excess (E) rainfall groups. El Nino was present in 18 years and La Nina in 24 years out of 126 years. The rest 84 years were under neutral condition. Also in 49 years it was under normal rainfall and deficit in 21 years & excess in 17 years.
Figure 4 presents the anomaly of all-India Summer Monsoon Rainfall for 1871-2009. Vertical lines represent rainfall anomalies [red below the average and green above the average]. Circles on the vertical lines represent El Nino years with red colour and La Nina years with green colour. During below the average 30-year period cycle [1897-1926; 1957-1986], El Nino presents drought conditions and similar pattern with La Nina and floods is not seen. From Table 3 it is clear that during neutral condition rainfall is seen from deficit to excess conditions. This is also seen in Figure 4. That means ENSO alone don’t explain the yearly rainfall for the forecasting. By joining ENSO with natural variability in rainfall might give better results in the long range forecasts of All-India SWM rainfall, which is 87% of annual.
| SO | Number of Years | |||||
| Events | D | BN | N | AN | E | Total |
| El Nino | 7 | 5 | 5 | 0 | 1 | 18 |
| Neutral | 14 | 13 | 37 | 14 | 6 | 84 |
| La Nina | 0 | 0 | 7 | 7 | 10 | 24 |
| Total | 21 | 18 | 49 | 21 | 17 | 126 |
D = Deficit, BN = Below Normal, N = Normal, AN = Above Normal, E = Excess Rainfall years
Table 3: Southern Oscillation [SO] versus Indian Southwest Monsoon Rainfall [1880 – 2006].
Table 3: Southern Oscillation [SO] versus Indian Southwest Monsoon Rainfall [1880 – 2006].
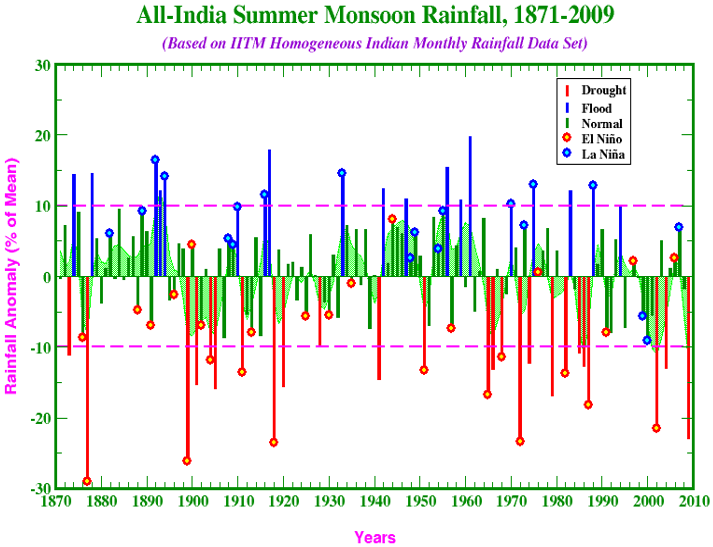
Figure 4: Yearly March of All-India Annual Rainfall with El Nino [Red circles] and La Nina years [green circles]
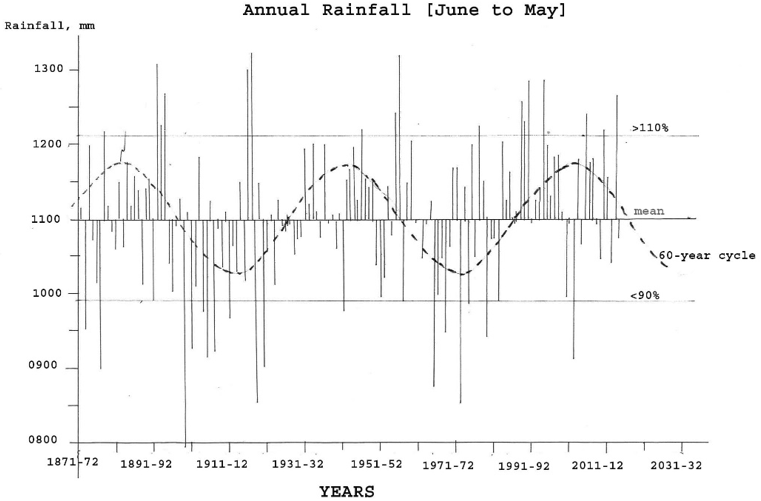
Figure 5 presents the all-India Annual Rainfall [Reddy, 2019b]. However, the data of IITM after 1990 [Figure 4] appears to be not in line with the data used by CWC [1985/86 to 2014/15] [Figure 5].
Nobel Prize for global warming theories!!!
On 12th August 2021, I sent my observations/comments on IPCC-AR6-WG-I in which I said that: “The entire issue runs around there is an increasing greenhouse gas and they are contributing to rise in temperature. However, since 2000 they are struggling to get a scientifically defined value for “Climate Sensitivity Factor” that defines the link between greenhouse gases and temperature by following trial and error approach with no real solution. This is the basic problem in IPCC approach of top to down as there are several variables with no clear cut values like cloud cover and water vapour. The greenhouse gases measurements started around 1960. The carbon dioxide concentrations in the atmosphere presented a linear increase with the population growth. This is clearly seen in Southern Hemisphere wherein less population, less carbon dioxide and lower temperature with less land area; and in Northern Hemisphere wherein more population, more carbon dioxide and higher temperatures with more land area – sea temperatures are less than that of land temperatures. Humans inhale air – is not pollution -- use oxygen and release carbon dioxide. However, the basic issue is that carbon dioxide contribution to temperature in the presence of cloud cover and water vapour wherein they directly interact with the Sun’s Energy in raising the temperature.
On 12th August 2021, I sent my observations/comments on IPCC-AR6-WG-I in which I said that: “The entire issue runs around there is an increasing greenhouse gas and they are contributing to rise in temperature. However, since 2000 they are struggling to get a scientifically defined value for “Climate Sensitivity Factor” that defines the link between greenhouse gases and temperature by following trial and error approach with no real solution. This is the basic problem in IPCC approach of top to down as there are several variables with no clear cut values like cloud cover and water vapour. The greenhouse gases measurements started around 1960. The carbon dioxide concentrations in the atmosphere presented a linear increase with the population growth. This is clearly seen in Southern Hemisphere wherein less population, less carbon dioxide and lower temperature with less land area; and in Northern Hemisphere wherein more population, more carbon dioxide and higher temperatures with more land area – sea temperatures are less than that of land temperatures. Humans inhale air – is not pollution -- use oxygen and release carbon dioxide. However, the basic issue is that carbon dioxide contribution to temperature in the presence of cloud cover and water vapour wherein they directly interact with the Sun’s Energy in raising the temperature.
IPCC claims that “The IPCC doesn’t tell governments what to do. Its goal is to provide the latest knowledge on climate change, its future risks and options for reducing the rate of warming. The IPCC doesn’t conduct its own climate-science research. Instead, it summarizes everyone else’s. This report – the first of four that make up the IPCC’s Sixth Assessment Report – looks at the physical science behind climate change and its impacts”. If this is so, where is the need to have a political body like IPCC, this can be executed by its parent scientific body, WMO, wherein all met services, who are more qualified in this area, in the World form part of it. To get a glimpse of that future, scientists run experiments using computer models that simulate Earth’s climate. The IPCC uses a set of scenarios to try to understand what the future might look like. All climate models work a little differently and create different results. That means IPCC helping wasteful expenditure and producing more air pollution and Carbon Dioxide.Fundamentally Climate Change is “real” but not Global Warming, which is a fictitious value that serves the vested interest groups to collect 100 billion dollars per year up to five years to share under the disguise of Green Fund.
- The Nobel Peace Prize 2007 was awarded jointly to Intergovernmental Panel on Climate Change [IPCC] and Albert Arnold (Al) Gore Jr.” for their efforts to build up and disseminate greater knowledge about man-made climate change, and to lay the foundations for the measures that are needed to counteract such changes” – Oslo, 12 October 2007.
- The Nobel Prize in Physics 2021 was awarded to one half jointly to Sykuro Manabe and Klaus Hassermann “for the physical modelling of Earth’s Climate, quantifying variability and reliably predicting global warming”. – Oslo, 5th October 2021.
IPCC in its AR4 concluded that Himalayan Glaciers will melt by 2035. On this when we brought to the notice of Environment & Forests Minister of India, IPCC’s the then chairman pronounced it as “voo-doo” science. In fact a note on this was going to press in Down To Earth, Nobel Prize Award was announced and then the Editor published instead of that another note of mine on Polavaram. After receiving Nobel Prize, IPCC said that the Himalayan Glaciers won’t melt by 2035 & expressed regret by saying that established standards of evidence not applied properly. Also, Al Gore withdrew his conclusion that “Greenland will become ice free in 5 years”. This was announced only after IPCC & Al Gore jointly receiving Nobel Prize. In 2014 a study of 2181 Himalayan Glaciers from 2000-2011 showed that 86.6% of the glaciers were not receding. This was informed to members of parliament in the session by minister concerned after his return from Paris meet in December 2015. This is the reality. Also unusually high snowfalls occurred in the last decade or so.
The Nobel Prize in 2007 and 2021 were awarded to work on Global Warming; that is Nobel Prizes are legitimizing fictitious global warming. Man-made climate change involves global component, termed it as “global warming” and local & regional components like “Urban-Heat-Island Effect” and “Rural-Cold-Island Effect”. According to IPCC AR5, more than half of the trend is associated with greenhouse effect and less than half is due to non-greenhouse effect. Global warming is part of greenhouse effect. Even if assume 50% of the trend as global warming, with the adjusted data series it is 0.45oC for 1951 [starting year of global warming as per IPCC] to 2100. If it is un-adjust data series it is zero.
Recently there is a hue and cry on CO2 increase under paddy cultivation – they used CO2 as a pollution which is not so as it is part of Air with long life in the atmosphere -- in the city of Hyderabad where I live, forgetting the fact that paddy cultivation [under irrigation] decreases the temperature in and around the farms – this was clearly revealed in Punjab. However, we must not forget the fact that changes in temperature are far less than those experienced in seasons, soils, etc.
There were two reports on Paddy fields releasing CO2 with different results, namely, (1) August 23, 2021: “Paddy leads to more CO2: study” – CSA [NGO] completed this study to understand the ecological footprints of paddy cultivation. According to agriculture scientist GV Ramanjaneyulu --- CO2 emissions, and meeting the suggested objective set by the IPCC on lowering CO2 emissions – must be reduced by 50% by 2030 from now to decrease the pace of climate change -- is very challenging. The study further said that the harmful methane (CH4) and nitrous oxide (N2O) emissions are part of CO2 equivalent wherein one tonne of CO2 contains 32 tonnes of methane and 300 tonnes of nitrogen dioxide. 1 hectare production releases 30,000 kg of emissions; and (2) October 18, 2021, page 4: “CO2 emissions from paddy crop in T 2.5L tonnes: PJTSAU”. – study says on dangerous emissions from paddy cultivation says that CO2 equivalent to paddy fields from Telangana is only 2.5 lakh tonnes but not in crore tonnes. The paddy cultivation does not pose any threat at the current level. From this we must know whose estimates are correct -- Government Agency or NGO? Or May be both are projecting to get funds from the coming COP26 – Green Fund???
Since around 1960 greenhouse gases observation network was in operation – WMO Fact Sheet [only a few locations – in tropics no station]. That is CO2 observations since 1960 to date followed linearly with population. We inhale Air from the atmosphere and use Oxygen and release CO2 in to the atmosphere. That shows CO2 is not pollution. In the Southern Hemisphere, land area & population are lower than Northern Hemisphere. CO2 in Southern Hemisphere is less than one-third of Northern Hemisphere.
CO2 has long life in the atmosphere but other greenhouse gases have shorter life and thus their contribution to long term trend practically nil as the natural cycle in global temperature presented a 60 year cycle. That means all those gases with less than 60 year in the atmosphere don’t contribute to trend as they are not cumulative in nature.
Finally why researchers are worried on CO2 release by paddy cultivation? Have they studied this increase will any way contribute to increase in temperature? Or they are blindly adapting IPCC’s pseudo global warming. In fact state level temperatures study in India showed that the major paddy growing Punjab and its neighbourhood presented negative trend [cooling effect – cold-island] and zero trend with Western Ghats zone presenting increasing trend. India agriculture scientists “instead of wasting their time and others times”, help farming and farming community in a positive way instead harping on global warming. Also I wanted ask them: “do you know the meaning of Climate Change” or simply using the word as an adjective?
I saw report on Paddy fields releasing CO2 dated August 23, 2021 and on the same page another report was also presented “Climate Change to bring down rice yield in T, AP”. Agriculture scientists, including those from the city based Central Research Institute for Dry-land Agriculture (CRIDA) have predicted a fall in potential rice yield from an average 3.62 tonnes per hectare to 3.11 tonnes per hectare by 2030 and to 3.02 tonnes per hectare by 2040s thanks to climate change and global warming. The same under rainfed conditions from 2.13 to 1.67 to 1.62 tonnes per hectare. They claimed that the study was spanned over 17 states including Telangana and Andhra Pradesh. They claimed that they arrived at the potential fall in rice yields based on 6.2 million simulations of climate change and global warming. This was published in Journal of Water and Climate Change. This is a wasteful study.
Human component
However, with the population growing leaps and bounds, human component changing the weather impact in diverse ways. Let us see few such cases:
However, with the population growing leaps and bounds, human component changing the weather impact in diverse ways. Let us see few such cases:
Hyderabad floods: Myths & Realities: In the case of Hyderabad after 1908 September devastating floods to Musi River, the then ruler built by 1930 two reservoirs, namely Himayatsagar & Osmansagar. With these two reservoirs Hyderabad has not experienced natural floods thereafter; now the floods are mainly associated with human destructive actions on nature. For example, Hussainsagar Lake was built in 1562 though Hyderabad was built later in 1591 covering an area of 5.7 sq. km. By 4th May 2000 “Save Lakes for a better Future” report noted it is 1356 acres. By “Restoration and Management of Hussainsagar waters” report noted it is 1066 acres; and by now it is around 700 acres with depth reduced to around 25 ft from around 41 ft; environmental groups filed several cases in APHC to protect the lake but judiciary went with government and as a result continuously the lake area and depth reduced.
- 80% of the rainwater drains were encroached;
- Flood waters on road causing severe traffic jams near TRS office – government tried to restore the nala on my request but TRS office later narrowed it. Few meters away from this we can see a deep and wide original rainwater drain;
- In 2000 Ashok Nagar floods reached 2nd floor level with political interference on nala widening;
- More than 50% of the area under water bodies & Musi River were encroached;
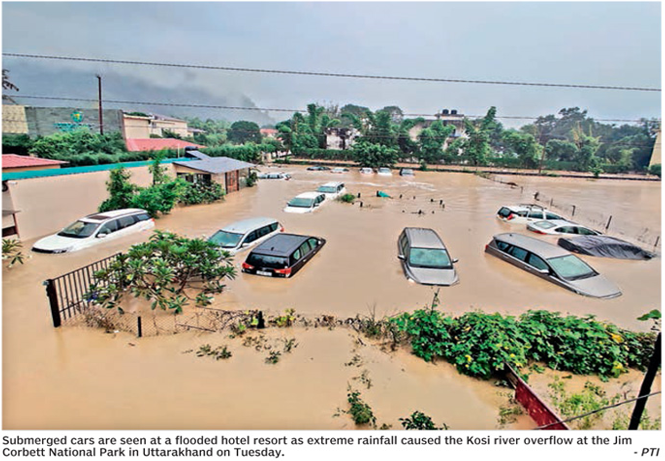
- In Contonment out of 13 ta nks left around three and that too partially. This lead to ICRISAT Colony – Phase-I in flood waters – military personal rescued residents by using boats & cars in flood waters [Figure 6a & b];
- In September 2016 Durgam Cheruvu neighbouring colonies flood with filthy water reaching 1st floor of the buildings with majority of up-steam lakes were either completely filled or partially filled with no drainage network only sceptic tanks–this is High Tech city;
- With ORR Phase-I Rajendranagar became a new flood prone zone as water entering Himayatsagar was blocked;
- Additional wastewater added to rainwater associated with ex-situ – around 50% is lost through leakages + pilferage] & groundwater sources is currently > 3000 mld;
- All these are steadily rising with population growth and thus the water holding capacity of water bodies reduced to 25-30% and with concrete jungle infiltration also has come down drastically. Even with little rain, water on the roads is new norm in Hyderabad with poor planning;
- I saw roads that helped infiltration of water immediately in Buenos Aries in Argentina, Petrolina - Juajero [twin cities] in Brazil, Rome in Italy & Geneva in Switzerland. Same was seen in villages in Kurnool district – but now they are changing;
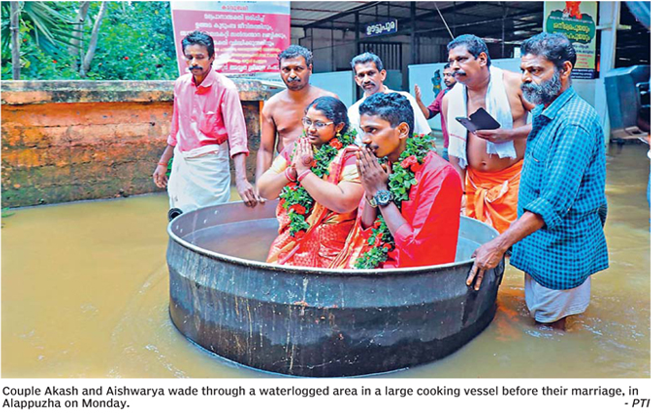
Figure 6a: In flood waters in Kerala bride & bridegroom were carried in a cooking vessel on 18th October 2021.
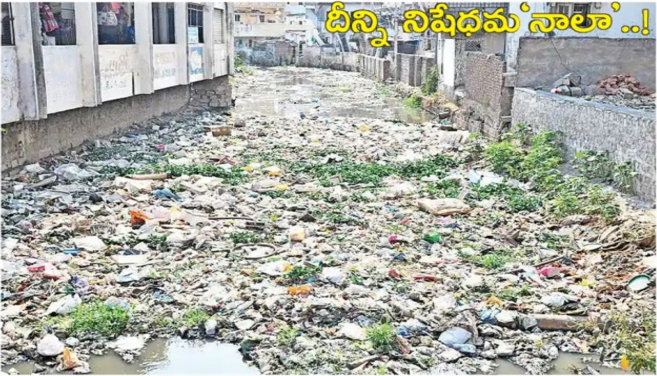
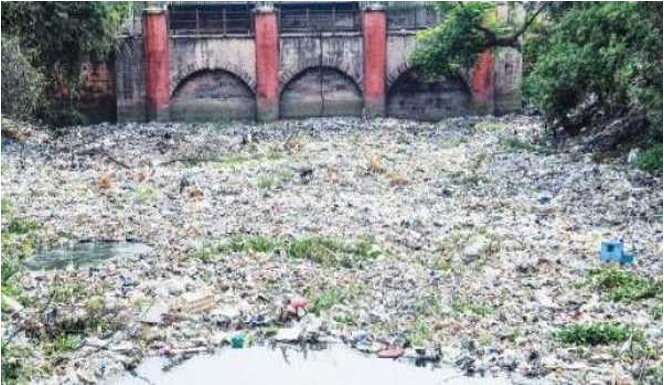
Figure 7a presents the Lingampalle to BHEL nala with plastic waste. Similar waste in Vijayawada [Figure 7 8b] created flooding of lowing areas by choking the nala under the bridge with the plastic waste. This caused human and property losses in Vijayawada.
Series of Committees formed to protect water bodies: 1. Hyderabad district Water Conservation Committee was formed to restore all the tanks in Hyderabad district in 2001 the committee recommended “protect and restore water bodies over the harvesting of rainwater from the roof tops – pits. With the help of NRSA got a map of water bodies using satellite data of Dec. 1975 to Dec. 2000. They found 932 tanks in HUDA area covering an area of 22,623.31 ha with 170 having more than 10 ha.
HUDA brought out a Notification on 4th May 2000 “Save Lakes for a Different Future”. This includes 169 lakes/tanks with more than 10 ha covering 9,022.8 ha. However, HUDA informed to the court in our PIL [I signed four] that this has no legal standing and laid the path for the destruction of Hussainsagar Lake. This is the style of functioning of Bureaucracy.
2. On the 2nd February 2010 Andhra Pradesh High Court with reference to our PIL in 2007 direct the government to create “Lake Protection Authority” but instead the government issued GO157 on 6th April 2010 creating “Lake Protection Committee” with IAS officials, who failed to protect the lakes for years since 2010 or earlier. On the contrarily, they encouraged Cyberabad Police Commissionrate to adapt these two lakes. They presented a plan of action that limits GO111 to FTL and create adda for anti-social activities around the two Lakes – like Necklace Road. With my intervention they withdrew from the project. With the Supreme Court order in 2000 all polluting industries with in the 10 km radius from the FTL of the two lakes as per GO111 of 1996 were closed. With Shamshabad Airport illegally coming up, created mushrooming of illegal structures, layouts & institutions both the government and private unhindered though IAS officers were assigned to stop such activities.
3. Now, a report on 14th September 2021 says “The State government has decided to appoint a special commissioner under GHMC for development and protection of water bodies in Greater Hyderabad limits”. It says that “The special commissioner will devise a comprehensive action plan for development of the 185 lakes and other water bodies within the city of Hyderabad. This will expedite the already ongoing development work of lakes”. That is, now one more IAS was added to the committee, what is going to happen, a big question?
We have seen the fate of Master Plans for HUDA, HMDA and MCH which served primarily the vested interest by converting residential zones in to commercial zones. So, this proposal will follow the foot-steps of Master Plans only and help to negotiating commercial activities related contracts around the water bodies. With our PIL in AP High Court, Hon’ble Court directed to demolish all illegal constructions in FTL and buffer zone of Durgam Cheruvu but no action and STP stopped; but now more area of FTL has gone in to commercial hub. This is the result of the so called beautification. At few other places locals objected on such schemes, which are creating bad atmosphere.
The Bangladesh High Court delivered on 30/31 January 2019 a historic judgment on river encroachments. In a petition, the organization cited a report published in “The Daily Star” on November 6, 2016 headlined “Time to Declare Turag Dead”. The court directed the authorities to remove all structures from it in 30 days. Also suggested action on such people and suggested create awareness to public. The grabbers include powerful individuals, businesses and ironically, government offices. Court ordered the government to amend the National River Protection Commission Act 2013, with the provisions for “punishment and fine for river grabbing” as the current Act hasn’t had such provisions for punishment. The High Court also declared this Act as the legal guardian of all rivers and act like their “parents”.
4. In GO 157 it says that “in compliance of APHC order dated 02.02.2010 have decided to constitute Lake Protection Committee for preservation and protection of Lakes in HMDA area pending consideration of enactment of separate legislation for constitution of Lake Protection Authority”. Why Lake Protection Authority was not created so far? The present CJI/SC as acting CJ of APHC raised this issue with the government but nothing happened.
Note: For the protection of lakes we will bring new Act – Preparation of this was assigned to Nalsar University – Minister Harish Rao under Mission Kakatiya said on 29th October 2017 [Sakshi, 30-10-2017] – after this several of the tanks were encroached fully or partially but no action was taken on such people; MA&UD Minister KTR said on 23rd September 2021 [media, dated 24th September 2021] we use special provisions in GHMC Act and if needed government will bring out Law for removing encroachments on Nalas. Though it is not new but in the last seven years no action was taken.
Therefore, we need to demand to formalize the “Lake Protection Authority”, to protect and restore the water bodies to minimise flood risk in future with provisions to remove all illegal structures and punishment & fine for encroachment of water bodies/nalas. Also Lake Protection Authority must be declared as the legal guardian of all water bodies including drains in and around Hyderabad. Also action needed: (a) Put a stop to idols immersion [pop & mud] in lakes; (b) Government must initiate restoring drains/nalas on priority basis and water bodies – see Figure 8, the debris of idols immersed in sea [Bay of Bengal] wash ashore, Visakhapatnam –; (c) Government must develop the city that reduces the flood causing activities; and (d) stop wastage of drinking water.
Cleaning Rivers and Coasts: Majority of the Rivers are passing through urban areas. Huge quantity of liquid and solid wastes have been dumping in to them and huge sums are allocated to clean them with no improvement except money goes in to the pockets of few criminals. Such water & waste finally reach coastal waters. With growing population the quantum increases. Though precautionary principle is part of environmental acts, the rulers rarely care to implement it; and instead follow post-mortem actions after getting reports at huge costs. The classical example is the water bodies in Hyderabad city.
However, the major issue is agriculture non-point source water pollution. In USA Mississippi River carry polluted water from agri farms and dump in to Gulf of Mexico that became dead zone. The only solution to this is not cleaning but change of chemical input agri technology to organic agri technology. This involves policy action by governments which have several international ramifications.
Dumping of waste both solid and liquid forms is not a scenario of developing countries but is more seen in developed countries. Though UK is holding COP26, it failed to implement the basic rules in pollution angle – a great pity. Water companies have been illegally dumping untreated sewage into rivers in England and Wales, an investigation by BBC Panorama has found.
Recent studies show that the US dumps the highest number of water bottles in the ocean. In fact, studies show that the US contributes as much as 242 million tons of trash in the ocean every year. However, it is undeniable that ocean litter is a mix of garbage from all around the globe. The water bottle could be from Los Angeles, the food container from Manila, the plastic bags from Shanghai. The amount of trash floating in the ocean is just too much for it to bear. The marine ecosystem is now severely polluted by plastic garbage, which comes from different countries, most of which are from Asia. While it’s great that humans are trying to clean up the patch, most of the efforts should instead go toward stopping the out-of-control flow of plastic garbage into the oceans.
It is a general belief that cruise ships simply dump their garbage in to the ocean. This is because they are constantly on the move, making waste management and disposal an added challenge to their day to day operations. The other major issue is oil spills.
Growing Trees: In line with the population, forest cover also showed the changing patterns. Reforestation world over in the past 20 years [2000 to 2019] showed an increase in area of forest cover the size of France, which is around 59 Mha to soak and store carbon dioxide of 5.9 giga tonnes. However, through deforestation 386 Mha of tree cover were last worldwide for timber, agriculture, etc. This is around 7 times to that of reforestation and thus to that extent carbon dioxide entered the atmosphere. Chile issued a decree subsidising tree planting ran from 1974 to 2012. The subsidy scheme expanded the area covered by trees, but decreased the area of native forest, which are rich in biodiversity and store large amounts of carbon. China government undertook intensive tree planting in northern China to help to reduce dust from the Gobi desert. Figure 9 shows the global deforestation and reforestation changes with the time. This support the above presented data also.
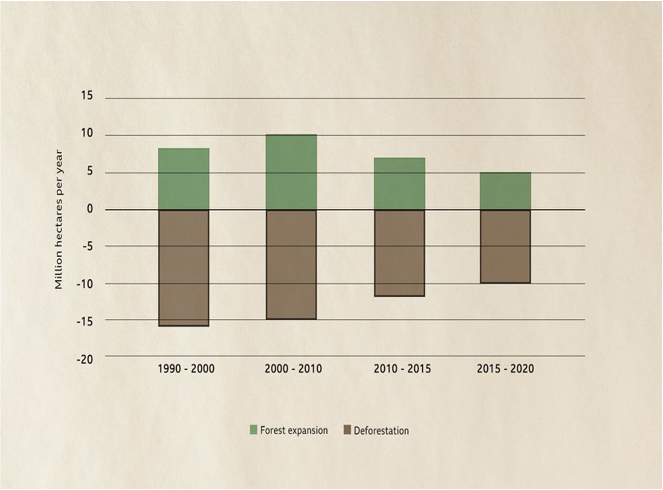
Source: World deforestation rates are slowing slowly overall, but in some of the world's most pristine forests it is still rapid (Credit: FAO/BBC)
Figure 9: Global deforestation and reforestation changes with the time.
Figure 9: Global deforestation and reforestation changes with the time.
Few years back a TV Channel presented live the butchering of pristine forest area with rich bio-diversity in AP/TS states in India around 8000 acres but government failed to take any action on that event. However, TS government initiated massive reforestation programmes in urban areas, rural areas and forest areas but the survival rates are very poor. Such incidents are quite common in India. Also put on fire is another story to grab the forest lands for other commercial activities – this has increased in Nallamala forests, Sheshachalam forests in Andhra Pradesh. These resulted wild animal intruding human habitats causing innumerable problems. I had an opportunity to participate in a TV Channel discussion few years back on the barbaric act of selling wild-animals meat similar to goat meat. It is a known fact that internationally elephant tusks were banned. Other major issues are Ganja cultivation and Mining.
The Western Ghats are south India’s lifeline, with millions dependent on the range either directly or indirectly. These mountains need protection. However, while new developments in the region continue to be human-centric, the entire concept of nature preservation is relegated. For real estate ventures the unscrupulous started destroying the Western Ghats too which has several ramifications including rainfall reduction, landslides, flooding, etc. And as the human population has grown, people have chopped down the forests and replaced them with spice, tea, coffee and rubber plantations. Thousands of illegal stone quarries now also operate in the Ghats, where mountainsides are demolished to generate stones and sand for the construction industry. Deforestation and the use of highly destructive explosives mean these areas are prone to increased seismic tremors and landslides.
Greening Cities/Rewilding Gardens: Age old trees have been butchered for growth of urban areas. The new plantation programmes have no plan and as a result in no time they have been butchered to pay the way for urban growth under new political centric plans. Also, with this huge tree waste is generated. Cleaning this is a major issue; in many cases they were/are burned or dumped into nalas/parks, etc. Builders have been introduced new “Green building Concept” to get higher premium for their ventures/buildings. Whatever may be the case, with urban growth – horizontally & vertically [that consume more power and changes local weather] on the ground and in the air contributing increased levels of carbon dioxide in the atmosphere? Also they directly contribute to urban-heat-island affect that increases the power consumption and thus more carbon dioxide contribution to environment indirectly.
A report suggests that “Though 93% of cities are conscious of the direct threats they face from climate change, require financing for actions include transport (16% of projects), renewable energy (12%), energy efficiency and renovation (12%) and water management (12%). Unfortunately, 25% of cities cite budgetary capacity issues as a barrier to adaptation through these kinds of actions. Cities that are already consider themselves as resilient -- and which have an action plan in place to deal with the effects of climate change -- include Melbourne/Australia, Buenos Aires/Argentina, Durban/South Africa, Barcelona/Spain and Paris/France. However, all these relate to carbon dioxide only and not realistic factors that affect life & natural ecology/biodiversity aspects.”
Mangroves: Mangroves is one another that act as natural barriers blunting the fury of the cyclonic storms and tidal waves. Apart from East Godavari, mangroves now found only Krishna and Guntur. Some of the last surviving mangroves in the state of AP were destroyed. In September 2007 on the request of Fishermen environmental groups [including myself] visited the site of RIL onshore project (Oil & gas) near Kakinada in West Godavari district. To our astonishment we found creeks were closed and mangroves were uprooted. When we took it up with local Forest Department officials at Kakinada and Rajahmundry, they confirmed the destruction of mangroves and creeks but expressed their helplessness, as it involved “a big and influential company”. Most of the creeks filled up and one of them diverted towards the Coringa Wildlife Sanctuary, posing a grave threat to it. Declared as a sanctuary in 1978, Coringa’s rich mangrove forest ecosystem along the Bay of Bengal is a heaven for flora and fauna. A special feature is the 18-km long sand spit where the endangered Olive Ridley turtle nests.
Here it is not the question of losing mangroves and creeks but the livelihood of hundreds of fishermen. They are worried as the fish catch has come down drastically, also a sure sign of the deterioration of the mangrove ecosystem. Both the Centre and the State Government for the last few years have been emphasising on the need to protect and develop mangroves, especially after the tsunami hit coastal belt. However, even after I sent a complaint to government alleged that the company had not been complying with the conditions laid down in Consent for Establishment order of APPCB & EC of MoEF nobody took action on the industry. However, when government allocated around1000 acres for establishment of power plant by saying that it is barren land but we found it is mangrove area. On our PIL in Court this was stopped by the government. This is a tip of ice berg. However, governments have been parting such lands to commercial ventures forgetting their importance.
Summary and Conclusions
- Maximum numbers of severe cyclonic storms were recorded in both summer [May in pre-monsoon season] and winter [November, post-monsoon season] in Bay of Bengal and Arabian Sea.
- Depressions reached to peak in August and September in monsoon season in Bay of Bengal but both depressions and cyclones were minimum number in Arabian Sea – maximum in June, October & November.
- However, the number of cyclonic storms during May to November in Bay of Bengal presented 56 year cyclic pattern. The Coastal Andhra Met Sub-division rainfall followed this pattern.
- In the case of Coastal Andhra the rainfall reached peak in October and Telangana Met Sub-division the rainfall reached peak in July.
- However, seasonal rainfall and annual rainfall presented typically different patterns.
- ENSO has three phases but unfortunately in maximum percentage years are under neutral condition compared to El Nino and La Nina conditions. Also El Nino and La Nina present normal conditions. In the rest below normal and deficit and above normal and excess. That means deficit [drought] and excess [flood] conditions are predicted rarely.
- That means one need to integrate all the scenarios before making blind conclusions on rainfall and disaster impact. In Urban Areas it is different.
- Nobel Prize was used to legitimize the fictitious Global Warming forgetting the facts that influencing climate at any given location and region. This misleading agriculture water resources availability. 2007 it was given to “man-made climate change” and in 2021 it is changed directly to “global warming”. However, till to date there is no answer to “Climate Sensitivity Factor”. Without solving this, there is no meaning saying “global warming”.
- Human interference on nature outplays the weather in urban areas as with poor town planning that serves the vested interests.
“THIS IS THE REALITY OF NATURE”
Acknowledgements
The research is self-funded. The author expresses his grateful thanks to those authors whose work was used for the continuity of the story. The author also confirms there is no conflict of interest involve with any parties in this research study.
Acknowledgements
The research is self-funded. The author expresses his grateful thanks to those authors whose work was used for the continuity of the story. The author also confirms there is no conflict of interest involve with any parties in this research study.
References
- Reddy, S.J., (1993): Agroclimatic/Agrometeorological Techniques: As applicable to Dry-land Agriculture in Developing Countries, www.scribd.com/Google Books, 205p; Book Review appeared in Agricultural and Forest Meteorology, 67 (1994):325-327.
- Reddy, S.J., (2000): Andhra Pradesh Agriculture: Scenario of the last four decades, Hyderabad, India, 104p.
- Reddy, S.J., (2002). Dry-land Agriculture in India: An Agroclimatological and Agrometeorological Perspective, BS Publ., Hyderabad, 429p.
- Reddy, S.J., (2008): Climate Change: Myths & Realities, www.scribd.com/Google Books, 176p.
- Reddy, S.J., (2016): Climate Change and its Impacts: Ground Realities, BS Publ., Hyderabad, India, 276p.
- Reddy, S.J., (2019a): Agroclimatic/Agrometeorological Techniques: As applicable to Dry-land Agriculture in Developing Countries [2nd Edition]. Brillion Publishing, New Delhi, 372p.
- Reddy, S.J., (2019b): Water Resources Availability over India. Brillion Publishing, New Delhi, 224p.
- Reddy, S.J., (2021a): Hypocrisy they Name: “Colorado River flow Shrinks from Climate Crisis, Risking Severe water Shortage” – A Note. Journal of Agricultue and Aquaculture, 2(2):14p.
- Reddy, S.J., (2021b): A note on: “Climate Change/Global Warming versus Climate Crisis”. Journal of Agriculture and Aquaculture 3(1), 23p.
Citation: Dr. S. Jeevananda Reddy. (2021). Disturbances Recorded in Bay of Bengal & Arabian Sea: A Note. Journal of Agriculture and Aquaculture 3(2).
Copyright: © 2021 S. Jeevananda Reddy. This is an open-access article distributed under the terms of the Creative Commons Attribution License, which permits unrestricted use, distribution, and reproduction in any medium, provided the original author and source are credited.

