Research Article
Volume 4 Issue 1 - 2022
A Note on “Coldwaves & Heatwaves”: Disturbances [Part-II]
Formerly Chief Technical Advisor – WMO/UN & Expert – FAO/UN Fellow, Telangana Academy of Sciences [Founder Member] Convenor, Forum for a Sustainable Environment Hyderabad, TS, India
*Corresponding Author: S. Jeevananda Reddy, Formerly Chief Technical Advisor – WMO/UN & Expert – FAO/UN Fellow, Telangana Academy of Sciences [Founder Member] Convenor, Forum for a Sustainable Environment Hyderabad, TS, India.
Received: November 10, 2021; Published: February 05, 2022
Abstract
The study presents the issues relating to winter and summer disturbances assciated with general circulation patterns over different parts of the globe. Discussed scenarios of India and mid-ltitude zones [USA-Canada, Australia, New Zealand, Argentina, etc.]. In the case of India western disturbances form part of general circulation patterns that direct the heatwaves in summer and coldwaves/rainfall-snowfalls in winter. In the case of mid-latitude zones the polar vortex – Jet Stream form part of general circulation patterns that direct them. Here the wind is the driving force but not global warming as evident from the historical facts in terms of severity/intensity. In fact, they are part of natural system of weather and climate. There is a need to make efforts to catologue the events under different seasonal conditions at local, regional and national level and instead making statements from the air which make the Science a mockery that affect future generations understanding on weather and climate. This is part-II of earlier article “Disturbances Recorded in Bay of Bengal & Arabian Sea: A Note”.
Keywords: Heatwaves; Coldwaves; General circulation patterns; Polar vortex; Jet stream; Western disturbances
Introduction
Reddy & Rao (1978) presented that “Western disturbances are very important part of General Circulation Pattern (GSP) in Indian weather in summer and winter. In summer it causes heatwaves and in winter coldwaves and rainfall/snowfall. There are several weather systems that cause rainfall over Indian region. Among these, western disturbances are of particular importance for the rabi crops in India. They also cause thunderstorm activity, widespread fog and coldwave conditions. Fog and thunderstorms are hazardous for transport and aviation while the coldwave conditions adversely affect human life and crops. This article attempted to classify the lower troposphereic wind patterns associated with western disturbances into few types and associated a particular sequance of weather with each type.”
Normally in winter, an anticyclonic flow pattern [high pressure belt near Nagapur latitude, a permanent feature] is seen upto 0.9 km level over northwest India. When an active western disturbance (associated with weather like rainfall etc.) approaches northwest India, the anticyclonic circulation over northwest India is replaced by a cyclonic circulation. In addition to this, another significant feature observed is that the extension of weather to a lower latitude is associated with a shift of the ridge line at 850 mb level to a lower latitude. Same is the case with summer heatwaves in association with the Western Disturbances. The anticyclone persists even in summer in north India. Also low pressure systems in Bay of Bengal and Arabian Sea changes the wind flow directions. It is the same with USA-Canada and New Zealand heatwaves and coldwaves/rainfall and ice-snow storms.
Reports state that “Strong warm winds over the Sahara desert typically whip up sand in summer and carry it thousands of miles across the Atlantic Ocean to the Americas. According to NOAA, dust and dry air forms above the Sahara Desert each late spring, summer and early autumn which then moves over the tropical Atlantic. “Normally, hundreds of millions of tons of dust are picked up from the desert of Africa and blown across the Atlantic Ocean each year”, Dust cloud moved in to USA after travelling 5000 km via the Atlantic Ocean. The densest plumes make the cloud larger than the contiguous United States and Western Europe. Europe also affected by such dust storms from Africa. Several other local systems such as earthquakes, tsunamis, volcanic eruptions, etc. contribute significant changes in weather and climate. It is also true with wars (Reddy, 2021a). Even in India dust storms are common in north Indian region.
Daijiworld’s two contrasting reports
Daijiworld presented two contrasting reports in October 2021 wherein one relates to un-scientific mode and another relates to scientific mode. These are discussed in this section.
Daijiworld presented two contrasting reports in October 2021 wherein one relates to un-scientific mode and another relates to scientific mode. These are discussed in this section.
Unscientific mode
The unscientific mode report presented a collection of statements appeared in the literature in support of global warming “Heatwaves, extreme droughts in 2020 had worst impact on health: Lacet” on October 21, 2021. In 2020, adults over 65 were hit by 3.1 billion more days of heatwave exposure than in the 1986-2005 baseline average and the senior citizens from China, India, the US, Japan, and Indonesia were the most affected.
The unscientific mode report presented a collection of statements appeared in the literature in support of global warming “Heatwaves, extreme droughts in 2020 had worst impact on health: Lacet” on October 21, 2021. In 2020, adults over 65 were hit by 3.1 billion more days of heatwave exposure than in the 1986-2005 baseline average and the senior citizens from China, India, the US, Japan, and Indonesia were the most affected.
The reality is – We must not forget the fact that this parameter is highly variable with year to year and region to region (Reddy, 2021a). De et al. (2005) presented state-wise number of heat & cold -waves during 1911 to 1999 & 1901 to 1999, respectively in India. India Meteorological Department [IMD] identified core heatwave zones that spans over Punjab, Himachal Pradesh, Uttarkhand, Delhi, Haryana, Rajasthan, Uttar Pradesh, Gujarat, Madhya Pradesh, Chhattisgarh, Bihar, Jharkhand, West Bengal, Odisha, Telangana and Meteorological sub-divisions of Madhya Maharashtra, Marathwada and coastal Andhra Pradesh. In fact these are in the path of western disturbances (Reddy & Rao, 1978). Here not only temperature but also relative humidity plays an important role; and they can be integrated under wet bulb temperature (Reddy, 1976) – this is prominently seen in Bihar. Also see Reddy (1974), Philip & Reddy (1974) and Reddy & Jayanthi (1974) presented human comfort related issues.
Climate change is driving an increase in the frequency, intensity and duration of drought events, threatening water security, sanitation, and food productivity, with 19% the global land surface in 2020 affected by extreme drought in any given month, the 2021 Report of the Lancet Countdown on Health and Climate Change: Code Red for a Healthy Future; Increasing the risk of wildfires and exposure to pollutants, this extreme drought over 19% global land surface is worrying as this value had not exceeded 13% between 1950 and 1990. The five years with the most areas affected by extreme drought have all occurred since 2015. The Horn of Africa, a region impacted by recurrent extreme droughts and food insecurity, was one of the most affected areas in 2020."
The reality is – Observed and predicted patterns of rainfall for Durban in South Africa, Mahalapye in Botswana and Catuane, Maputo & Beira in Mozambique [see Figure 1] are presented by Reddy (1993). The predicted patterns were derived based on 66 year cycle and its sub-multiple of 22 years in the case of Durban; 60 year cycle and its sub-multiples of 30, 20 & 10 years in the case of Mahalapye; and 54 years cycle and its sub-multiple of 18 years in the case of Catuane, Maputo & Beira. Table 1 presents the current cycle/period and wet (+) and dry (-) periods in that cycle in years. Current starting year of dry period for Durban is 2010, for Mahalapye is 2022 and starting year of current wet period for Beira is 2012.
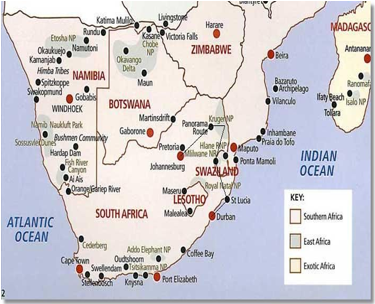
Figure 1: Map depicting Mozambique [Beira, Maputo, Catuane], South Africa [Durban and Cape Town] & Botswana [Mahalypye].
| Location/Country | Cycle periods (Years) | Period (Years) | Wet (+) & Dry (-) |
| Durban/South Africa | 66 & 33 | 2010-2075 | -14 +5 -14 +14 -5 +14 |
| Mahalapye/Botswana | 60 & 30, 20, 10 | 1993-2052 | -12 +6 -12 +10 -8 +12 |
| Beira/Mozambique | 54 & 18 | 1985-2038 | -11 +5 -11 +11 -5 +11 |
| Catuane/Mozambique | 54 & 18 | 1997-2050 | -11 +5 -11 +11 -5 +11 |
| Maputo/Mozambique | 54& 18 | 1979-2032 | -11 +5 -11 +11 -5 +11 |
Note: see Figure 1 for locations.
Table 1: Predicted patterns of wet and dry periods for stations in Mozambique, Botswana & South Africa.
Table 1: Predicted patterns of wet and dry periods for stations in Mozambique, Botswana & South Africa.
The integrated predicted patterns present W [below the average part of the cycle] and M [above the average part of the cycle] shapes. In the case of W, -, +, - [dry, wet, dry] and for M, +, -, + [wet, dry, wet]. That means during below the average period continuous dry period is not occurring and vice versa is the case with above the average condition [Reddy, 1993, 2002, 2008, 2019a, b & c and 2021a & b)].
The report also talks about the potential for outbreaks of dengue, chikungunya and Zika increasing most rapidly in countries with a very high human development index, including European countries. Suitability for malaria infections is increasing in cooler highland areas of countries with a low human development index. "Coasts around northern Europe and the US are becoming more conducive to bacteria, which produces gastroenteritis, severe wound infections and sepsis. In resource limited countries, the same dynamic is putting decades of progress towards controlling or eliminating these diseases at risk," it said. The report outlined the growing risks to health and climate and exposed inequities in the global response to climate change in general.
The reality is -- All this is like “he buffalo gave birth to a calf then in response tell him to tie the knot to the calf”
"It is the countries lowest on the human development index and often least responsible for rising greenhouse gas emissions that are lagging behind in climate change adaptation and mitigation efforts and in realising the associated health benefits of accelerated decarbonisation." Observing that the world continues to subsidise fossil fuels, the report said, in 2018, 65 out of the 84 countries analysed by the Lancet Countdown researchers had net-negative carbon price equivalent to an overall subsidising fossil fuel. The report pointed out how climate change and its drivers are creating ideal conditions for infectious disease transmission, potentially undoing decades of progress to control diseases such as dengue, fever, chikungunya, Zika, malaria and cholera and said, only 45 of the 91 countries (49%) in 2021 reported having carried out a climate change and health vulnerability and adaptation assessment. Only eight out of those 45 countries reported that their assessment of the effects of climate change on their citizens' health had influenced the allocation of human and financial resources. As many as 69% of the countries said insufficient financing was a barrier to implementing these plans, the report said.
The reality is – After 1960 the chemical input agriculture technology wherein seeds were tailored to chemical inputs and later GM seeds also tailored to chemical inputs that created food, water, air pollution [Reddy, 2019b & 2021a]. Adulteration of food, milk and milk products are rampant. All these are health hazardous ingredients linked to multinational Companies Greed and poor governances at state and Centre – though in 2013 food security and nutrient bill was passed this was not effectively implemented by both Centre and States. Scientific groups emphasised the need to eat millets based food that is highly nutritious – bill includes Pearl Millet, Sorghum & Finger Millet but not supplied to ration shops. States think it is a burden on the state’s exchequer. High Level Panel of Experts open e-consultations “Re: Food Security and Nutrition: Building a global narrative towards 2030 - HLPE e-consultation on the Report’s scope” I submitted my observations on 18.12.2018. The definitions of food and nutrition security vary with crops grown over (a) developed versus developing counties; (b) regions within the country; (c) rainfed versus irrigated agriculture; (d) polluted water versus non-polluted water; (e) chemical fertilizers versus non-chemical fertilizers; (f) adulterated food versus wastage of food versus using chemicals-preservatives for the preservation/ripening of fruits, etc. For example in Ethiopia around the capital city Addis Ababa [moderate rainfall zone] “tef” is the major staple food crop grown; but when you move to northwest [moderate to high rainfall zones] barley, wheat, tef, etc. are staple food crops grown; and in the southeast [low rainfall zones] millets + pulses are staple food crops grown, mostly under rainfed condition.
"The 2021 report shows that populations of 134 countries have experienced an increase in exposure to wildfires. Millions of farmers and construction workers could have lost income because on some days it is just too hot for them to work. Drought is more widespread than ever before. The Lancet Countdown report has 40 indicators and far too many of them are flashing red," said Executive Director of the Lancet Countdown, Professor Anthony Costello.
The reality is – It is only wild guess and not based on facts. Also they are confined to some pockets and that too on some occasions.
The Lancet Countdown report represents the consensus of leading researchers from 38 academic institutions and UN agencies. The report exhorted politicians to show "leadership moving beyond rhetoric" by taking action at the UN climate change conference (COP26) which will take place from October 31 in Glasgow, Scotland. "Carbon emissions must be rapidly reduced to improve health and to provide a more equitable, sustainable future," it asserted. However all these are not based on scientific evaluation but taken from air.
The reality is – not based on science as so far there is no scientifically accepted “Climate Sensitivity Factor” except followed “trial and error” approaches that lead wide variations in terms of researcher to researcher and model manipulation to model adaptations. All these are to get a share in Green Fund at COP26 meet. DaijiWorld presented my article as “Special” titled “Global Warming: Neither Climate Change nor its Man-Made” by me on 27th October 2021.
Scientific mode
The scientific mode article is “What caused devastating rains in Uttarkhand, Kerala at this time of the year?” by Nivedita Khandekar on October 20, 2021. As scary visuals of devastating floods causing damage to infrastructure in Uttarakhand steadily poured out of the state on social media, a most common question asked was, 'Is this happening because of climate change?' ------
The scientific mode article is “What caused devastating rains in Uttarkhand, Kerala at this time of the year?” by Nivedita Khandekar on October 20, 2021. As scary visuals of devastating floods causing damage to infrastructure in Uttarakhand steadily poured out of the state on social media, a most common question asked was, 'Is this happening because of climate change?' ------
Frequency of Western Disturbances are maximum in the months of December and January, but throughout the year, there are WDs. "In monsoon season too, there is WD. In 2013, on June 16, it was an active WD like the current one. The low-pressure area was laying over Uttar Pradesh. Both interacted and it caused extremely heavy rainfall leading to the Kedarnath tragedy," recalled IMD Director General, Mrutyunjay Mahapatra. However, Mahapatra refused to directly attribute the frequency of WD or the extreme weather event to climate change as he said, interaction between WDs and low-pressure areas led to this extreme weather episode, and this has happened earlier too. "The frequency of heavy rainfall events is increasing due to climate change, especially in association with low pressure areas." -----
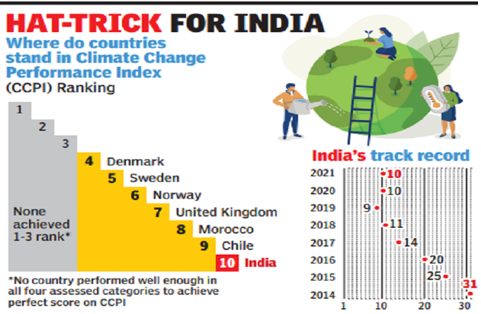
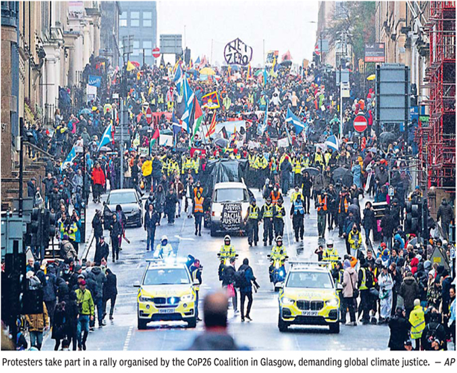
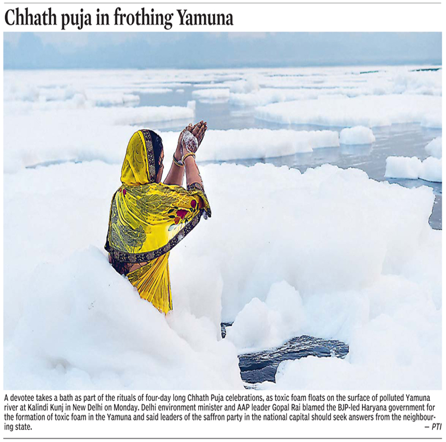
The reality is -- Indian rainfall presents a cyclic variation with high and low rainfalls [Reddy, 1993, 2002, 2019a, 2021a & b]. This is the case with 2013 devastating floods of Uttarkhand, Srinagar Jeelam River floods in 2014, Chennai-Nellore floods in 2015, Hyderabad floods in 2000/2016, Mumbai floods in 2018, etc. [Reddy, 2019c & 2021a]. Figure 2a presents the global climate change performance index released by German-watch on the side-lines of the COP26 on 9th November 21. According to this index India was placed at 10th, China at 37th and USA at 55th. Such index has no meaning as crores of people in India are suffering from floods, particularly urban floods and water pollution, particularly major rivers. The capital city of India, Delhi is facing severe Air Pollution – carbon dioxide is not air pollution. The basic problem in present day humans is like “flies flock together around sweeteners” wherein people went all the way to Glasgow for protests like flies See Figure 2b; but women devotee is standing in polluted water to pay her respect to almighty, none has concern for such dangerous pollution -- Figure 2c.
Circumpolar Vortex – Jet Stream
Introduction
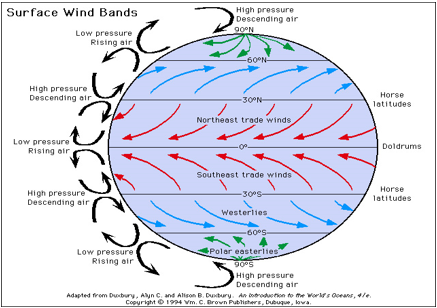
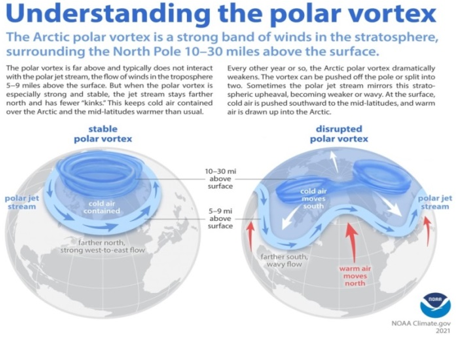
The science of meteorology has come a long way in the past few decades, so much so that meteorologists saw this extreme winter weather coming many weeks in advance. That's because this extreme pattern was initiated by a large and recognizable phenomenon which unfolded in the Arctic at the beginning of the year called Sudden Stratospheric Warming [SSW]. SSW's are a natural occurrence, which happens every couple of winters and portend extreme weather in the weeks following them. That's because when the Arctic warms rapidly it disrupts a spinning mass of cold air — the polar vortex — a semi-permanent weather system which is present each winter. Normally the jet stream winds around the vortex and acts as a lasso of sorts, keeping the cold air trapped inside. But when it gets warm in the Arctic, the jet stream weakens and elongates, allowing the cold air to plunge south. This enables a broad mountain of warm air to form over the Arctic, temporarily supplanting the cold vortex. The warm mountain acts as an atmospheric block, redirecting the jet stream and bitter cold air southward. To understand the polar vortex, we need to understand a bit about the global wind patterns [Figure 3a].
The science of meteorology has come a long way in the past few decades, so much so that meteorologists saw this extreme winter weather coming many weeks in advance. That's because this extreme pattern was initiated by a large and recognizable phenomenon which unfolded in the Arctic at the beginning of the year called Sudden Stratospheric Warming [SSW]. SSW's are a natural occurrence, which happens every couple of winters and portend extreme weather in the weeks following them. That's because when the Arctic warms rapidly it disrupts a spinning mass of cold air — the polar vortex — a semi-permanent weather system which is present each winter. Normally the jet stream winds around the vortex and acts as a lasso of sorts, keeping the cold air trapped inside. But when it gets warm in the Arctic, the jet stream weakens and elongates, allowing the cold air to plunge south. This enables a broad mountain of warm air to form over the Arctic, temporarily supplanting the cold vortex. The warm mountain acts as an atmospheric block, redirecting the jet stream and bitter cold air southward. To understand the polar vortex, we need to understand a bit about the global wind patterns [Figure 3a].
The global climate and weather patterns are driven by a pretty simple principle: Cold air at the poles wants to move towards the equator, while warm air at the equator wants to move towards the poles (Figure 3a). The result is a pattern of rising and sinking air and high and low pressure systems. At each of the poles, a semi-permanent area of low pressure sits and spins continuously. This is the “polar vortex” – Figures 3b&c. In the winter the low strengthens and in the summer it weakens. But it is not a new phenomenon, having first been discovered by meteorologists in the 1850s. It is also not a cold, swirling storm of doom. Irrespective of scientific analogy, the fact is the movement of cold belt to south in to USA-Canada from Polar region is commonly seen every year but the intensity of cold and breadth and depth are different. We must remember the fact that the severity is not confined to recent years but they were seen even before 100 years. Without analysing the historical factors and simply attributing to global warming is like “blind man using a light pole” not for light but for support.
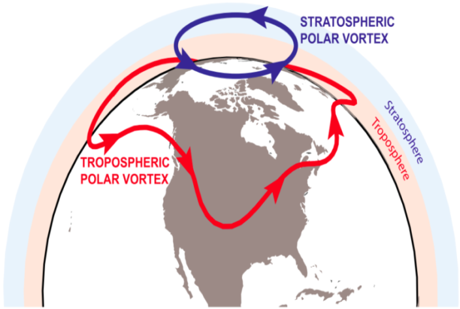
Figure 3c: Illustration of the stratospheric (blue) and tropospheric (red) polar vortices. [Source: © American Meteorological Society].
Another important feature in the global wind pattern is the jet stream (Figure 3b). The jet stream is a current of strong winds, usually between 30,000 and 40,000 feet above the ground. The jet stream separates cold air to its north and warm air to its south. When the jet stream builds into Canada, we get warmer. When it dips into the Southeast, we get colder. The jet stream is also often a major factor in the development of the snow storms we see and it has a role in severe thunderstorms. When the jet stream dives south in the winter, on occasion, a piece of the polar vortex (Figure 3c) can break off from the main low pressure and head south with the jet stream. This actually takes place fairly often, and is what happened this past winter. So while a piece of it breaks off and moves south, the vortex itself stays put over the Arctic. On rare occasions, the low pressure itself can get pushed south into Canada. Either way, the result is frigid air for the eastern two-thirds of the country.
Polar vortex and global warming
The question is whether global warming is affecting the polar vortex in a way that would—paradoxically—make severe winter weather outbreaks in the mid-latitudes? Disruptions of the polar vortex [Figure 3c] occur when the vortex is bumped from below by large-scale atmospheric waves flowing around the troposphere and these waves are always there, but anything that changes their strength or location—including changes in surface temperature and pressure that result from sea ice loss—can potentially influence the polar vortex. So the idea would be that even though you have an overall warming trend, you might see an increase in the severity of individual winter weather events in some locations.
The question is whether global warming is affecting the polar vortex in a way that would—paradoxically—make severe winter weather outbreaks in the mid-latitudes? Disruptions of the polar vortex [Figure 3c] occur when the vortex is bumped from below by large-scale atmospheric waves flowing around the troposphere and these waves are always there, but anything that changes their strength or location—including changes in surface temperature and pressure that result from sea ice loss—can potentially influence the polar vortex. So the idea would be that even though you have an overall warming trend, you might see an increase in the severity of individual winter weather events in some locations.
The polar vortex’s “preferred” location may be sensitive to regional variations in sea ice cover. For example, one study linked lower-than-average February sea ice extent in the eastern Arctic’s Barents and Kara Seas to a shift in the polar vortex toward Eurasia between the 1980s and the 2000s. The vortex shift was accompanied by colder-than-average winters across Siberia and the mid-latitudes of central Eurasia. But while the hypothesis is plausible, Butler said, “I don’t think there is any convincing evidence of a long-term trend in the polar vortex. What we see in the record is this is very interesting period in the 1990s, when there were no sudden stratospheric warming events observed in the Arctic. In other words, the vortex was strong and stable. But then they started back up again in the late 1990s, and over the next decade there was one almost every year. So there was a window of time in the early 2010s where it seemed like there might be a trend toward weaker, more disrupted or shifted states of the Arctic polar vortex. But it hasn’t continued, and more and more, it’s looking like what seemed to be the beginning of a trend was just natural variability, or maybe just a rebound from the quiet of the 1990s.” Here we must not forget the fact that the polar ice maxima and minima in a year pattern has 60-year cycle in both south and north poles according to 60-year cycle in Atlantic and Pacific Ocean temperatures – even the adjusted global annual average temperature anomaly showed 60-year cyclic variation [WMO, 1966; Reddy, 2008 & 2019a; BRS & USNAS, 2014)].
Without taking this, the inferences made attributing global warming, a pseudo parameter, means killing the science of meteorology & oceanography -- developed based on the studies carried out over centuries. “It’s tough, though,” Butler continues, “because we don’t have a very long record of observations of the stratosphere. We’ve only been observing it directly since the 1950s. That’s not very long to understand what kind of natural variability the polar vortex might be capable of. One researcher did a historical reconstruction by correlating the overlapping portions of the North Atlantic Oscillation index—which goes back much farther—and the polar vortex record, and then extrapolating the polar vortex record farther back in time using the NAO index. It showed no long-term trend and no big differences in recent decades compared to previous decades.” Some studies combining models and observations have shown a connection between low sea ice extent in the Barents and Kara Seas of the eastern Arctic, sudden stratospheric warming events, and cold winters in North America. It was argued that -- “The tropical upper troposphere is predicted to become warmer, which will likely enhance the equator-to-pole temperature gradient across the tropopause (the atmospheric layer that separates the troposphere from the stratosphere), which would speed up the polar vortex in both hemispheres. However, enhanced warming of the Arctic surface relative to the middle latitudes reduces the surface temperature gradient and may act on the Northern Hemisphere polar vortex in the opposite direction. Other climate factors being equal, a weaker vortex, with more frequent disruptions, could slow the rate of winter warming in the mid-latitudes while accelerating it in the Arctic. A stronger polar vortex, with few disruptions might be expected to slow Arctic warming at the expense of more rapid winter warming in mid-latitudes.
Stratospheric warming led to abnormal cold weather
Scientists have found that stratospheric warming led to the abnormal cold weather in the winter of 2020-2021. It influenced polar vortices, jet streams and the temperature of the Arctic Ocean. The research is published in the journal Advances in Atmospheric Sciences. 54.4°C is the highest temperature ever recorded on the Earth. It was recorded on July 9, 2021 in Death Valley, California. Most interestingly, the record heat came just a few months after record cold weather in the United States and Asia. Could these phenomena be related? An international research team looked at three cases of extreme cold to find out what mechanisms underlie these temperature fluctuations. “The general question that needs to be answered is why extreme weather events are more likely to occur in the context of warming in recent decades, and whether the increasing warming in the Arctic is playing a leading role. The extreme events of winter 2020-2021 provide a unique opportunity to study which physical processes or mechanisms lead to these events. Researchers studied two record cold outbreaks in China from late December 2020 to mid-January 2021. Beijing and Tiadzin saw their lowest temperatures in 54 years this winter: -19.7°C and -19.9°C, respectively. Also, scientists turned to the record cold weather in the south of the United States. The Texas cities of Austin and Houston both recorded the lowest temperatures in a century this winter (-13.3°C and -8.3°C, respectively). Scientists have compared the 2020-2021 winter to the previous 42 winters. They used observational data and computer models. So the researchers wanted to understand what marine and atmospheric phenomena could underlie extreme weather events. They found that the polar vortex (cold air at low pressure above the poles) and jet stream (air currents moving from west to east) play a key role. These are two atmospheric phenomena that carry cold air from the poles. A sharp rise in temperature in the upper atmosphere, called sudden stratospheric warming, can drastically change their behaviour and interactions. This will affect water temperatures in the Arctic Ocean, which in turn will make the weather even more extreme across the Northern Hemisphere. “The study shows that ocean temperature anomalies, in addition to large-scale atmospheric circulation, can play a key role in extreme weather events, complementing large-scale atmospheric circulation. Scientists note that although one process underlies all the extreme cold weather of the last winter, the cold snap manifested itself in different ways. For example, during the first event in East Asia, cold polar air modulated the jet stream in mid-latitudes, directing the cold air southward. In the second case, the polar vortex split open, deepening the low-pressure region and circulating with the colder Arctic air. And in the case of North America, the polar vortex was also split, but in this case forced the lower atmosphere to settle deeper in the south, putting pressure on the very cold air.
Scientists have found that stratospheric warming led to the abnormal cold weather in the winter of 2020-2021. It influenced polar vortices, jet streams and the temperature of the Arctic Ocean. The research is published in the journal Advances in Atmospheric Sciences. 54.4°C is the highest temperature ever recorded on the Earth. It was recorded on July 9, 2021 in Death Valley, California. Most interestingly, the record heat came just a few months after record cold weather in the United States and Asia. Could these phenomena be related? An international research team looked at three cases of extreme cold to find out what mechanisms underlie these temperature fluctuations. “The general question that needs to be answered is why extreme weather events are more likely to occur in the context of warming in recent decades, and whether the increasing warming in the Arctic is playing a leading role. The extreme events of winter 2020-2021 provide a unique opportunity to study which physical processes or mechanisms lead to these events. Researchers studied two record cold outbreaks in China from late December 2020 to mid-January 2021. Beijing and Tiadzin saw their lowest temperatures in 54 years this winter: -19.7°C and -19.9°C, respectively. Also, scientists turned to the record cold weather in the south of the United States. The Texas cities of Austin and Houston both recorded the lowest temperatures in a century this winter (-13.3°C and -8.3°C, respectively). Scientists have compared the 2020-2021 winter to the previous 42 winters. They used observational data and computer models. So the researchers wanted to understand what marine and atmospheric phenomena could underlie extreme weather events. They found that the polar vortex (cold air at low pressure above the poles) and jet stream (air currents moving from west to east) play a key role. These are two atmospheric phenomena that carry cold air from the poles. A sharp rise in temperature in the upper atmosphere, called sudden stratospheric warming, can drastically change their behaviour and interactions. This will affect water temperatures in the Arctic Ocean, which in turn will make the weather even more extreme across the Northern Hemisphere. “The study shows that ocean temperature anomalies, in addition to large-scale atmospheric circulation, can play a key role in extreme weather events, complementing large-scale atmospheric circulation. Scientists note that although one process underlies all the extreme cold weather of the last winter, the cold snap manifested itself in different ways. For example, during the first event in East Asia, cold polar air modulated the jet stream in mid-latitudes, directing the cold air southward. In the second case, the polar vortex split open, deepening the low-pressure region and circulating with the colder Arctic air. And in the case of North America, the polar vortex was also split, but in this case forced the lower atmosphere to settle deeper in the south, putting pressure on the very cold air.
The polar vortex, climate change and the ‘Beast from the East’
While much of Europe is shivering in sub-zero temperatures the Arctic and eastern US have basked in unseasonably warm conditions in recent weeks. Arctic temperatures during February hit record highs, including nine separate days where temperatures were above zero. This is more than 30oC warmer than expected for an Arctic winter. Numerous news reports have pointed the finger at the “polar vortex” for this unusual combination of weather extremes. Some have suggested that climate change is making these events more likely, driven by declining Arctic sea ice. So what is the polar vortex? How does it affect mid-latitude weather? And what role – if any – is climate change playing? The realistic answer to this, we can see below.
While much of Europe is shivering in sub-zero temperatures the Arctic and eastern US have basked in unseasonably warm conditions in recent weeks. Arctic temperatures during February hit record highs, including nine separate days where temperatures were above zero. This is more than 30oC warmer than expected for an Arctic winter. Numerous news reports have pointed the finger at the “polar vortex” for this unusual combination of weather extremes. Some have suggested that climate change is making these events more likely, driven by declining Arctic sea ice. So what is the polar vortex? How does it affect mid-latitude weather? And what role – if any – is climate change playing? The realistic answer to this, we can see below.
Arctic & Antarctic Sea Ice Melt
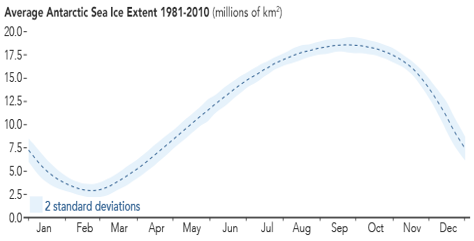
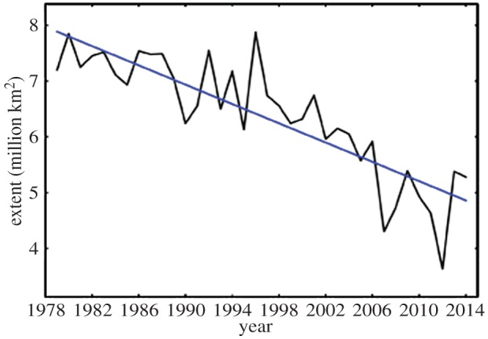
Figure 4a presents average Antarctica Sea Ice extent of 1981-2010 [million of km2]. The minimum is seen in between February-March and maximum is seen in between September-October varied between around 2.5 and 20.0 million of km2 – seasonal variation. However, the important issue here is that there is no change in these with years. The satellite data of 1978 to 2014 showed the minimum varied between 2.25 (1975) and 3.65 (2012) and the maximum varied between 17.5 (1986) and 19.2 (2014) which means 1.4 and 1.7 million of km2. We must remember the fact that these ranges of maximum and minimum were not for the same period, which means “random variations”.
Figure 4a presents average Antarctica Sea Ice extent of 1981-2010 [million of km2]. The minimum is seen in between February-March and maximum is seen in between September-October varied between around 2.5 and 20.0 million of km2 – seasonal variation. However, the important issue here is that there is no change in these with years. The satellite data of 1978 to 2014 showed the minimum varied between 2.25 (1975) and 3.65 (2012) and the maximum varied between 17.5 (1986) and 19.2 (2014) which means 1.4 and 1.7 million of km2. We must remember the fact that these ranges of maximum and minimum were not for the same period, which means “random variations”.
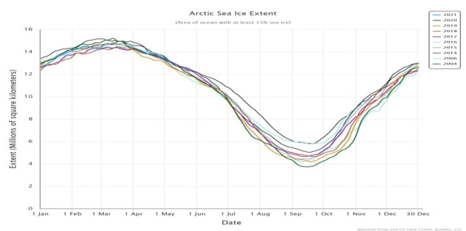
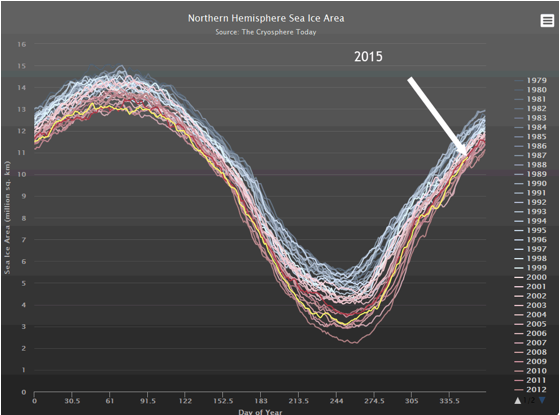
Figure 4b presents the Arctic Sea Ice Extent for 2014-2021 & 2004 & 2006 in Millions of km2. Maximum is reached in March and minimum in between September-October. However there is no change in these with years. However they varied between 4 and 15 Millions of km2. In the case of minimum Arctic is higher than Antarctic and in the case of maximum Arctic is lower than Antarctica in Sea Ice Extent. Most important point: During April-May-June the year to year changes is the lowest; September-October is the highest and next in between February-March. These clearly suggest the fact that there is no global warming impact on these both at Arctic and Antarctic. They systematically follow the Sun. Figure 4c presentsArctic Ice Volume: 1979-2015.
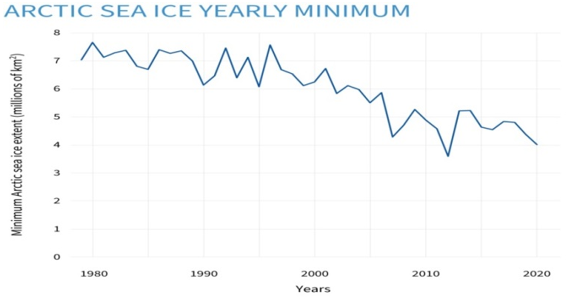
The Sea Ice Extent for Arctic, 2021 minimum is above 2012 value. In both the figures during 1978 to 1998 there is no trend and same is the case during 2005 to 2020. However there is a sharp drop in the Sea Ice Extent in between these two segments is a big question? Is it a part of natural 60-year cycle? However, it is clearly seen from Figure 4b that during April-May-June the changes in Arctic Sea Ice extent are insignificant – this is also reflected in Figure 4c. That means, whatever may be the change in minimum or maximum, there is little change has been noted during April-May-June However in recent years human direct interference with the arctic region might have causing some changes in minimum values – transport, sports, oil and gas extraction, etc. Figure 5a & b present the satellite data trend for Arctic Sea Ice extent for the period 1987 to 2014 & 1987 to 2000.
Cold waves
Introduction
Cold waves and heat waves are common to world countries. The reasons vary from country to country, particularly to tropical to mid-latitudes to polar-regions on the one hand, coastal to inland to hill regions on the other as localized with patterns in addition general circulation patterns in relation to climate system [Gupta & Reddy, 2009 & Reddy, 2016]. With reference India western disturbances form part of general circulation patterns in winter and summer. In winter the coldwaves and rainfall/snow fall form part of winter circulation pattern. In a similar way in the mid-latitudes in place of Western Disturbances, they are directed by Jet Stream and polar vortex both are part of general circulation of the region. However, all these refer to wind systems only. However, these are modified by localized conditions at the time of their occurrences. Sometimes they are very severe and some other time they are weak. But unfortunately these changes are attributed to global warming a fictitious phenomenon. Low pressure systems in Bay of Bengal and Arabian Sea play major role in diverting the flow systems.
Cold waves and heat waves are common to world countries. The reasons vary from country to country, particularly to tropical to mid-latitudes to polar-regions on the one hand, coastal to inland to hill regions on the other as localized with patterns in addition general circulation patterns in relation to climate system [Gupta & Reddy, 2009 & Reddy, 2016]. With reference India western disturbances form part of general circulation patterns in winter and summer. In winter the coldwaves and rainfall/snow fall form part of winter circulation pattern. In a similar way in the mid-latitudes in place of Western Disturbances, they are directed by Jet Stream and polar vortex both are part of general circulation of the region. However, all these refer to wind systems only. However, these are modified by localized conditions at the time of their occurrences. Sometimes they are very severe and some other time they are weak. But unfortunately these changes are attributed to global warming a fictitious phenomenon. Low pressure systems in Bay of Bengal and Arabian Sea play major role in diverting the flow systems.
Arctic links to mid-latitude winter weather
In a recent paper, Overland and several co-authors argued that if Arctic warming is affecting extreme weather events in the mid-latitudes it’s through intermittent connections that amplify an extreme event only when the background atmospheric conditions are already favourable. As an example, he points to a study that described how an atmospheric river event combined with historically low November sea ice extent in the Bering and Chukchi Seas in 2017 to intensify a ridge of high pressure over the Pacific Arctic. Both up and downstream of the amplified ridge, the polar jet stream developed deep troughs, which allowed cold polar air to spill south into both East Asia and North America in early winter. “So the lack of sea ice alone doesn’t cause the events,” said Overland, “but once the background conditions are set up, the heat flux from the ice-free ocean to the atmosphere along with warm air flowing in from lower latitudes can help reinforce the jet stream high pressure areas. Maybe make a downstream cold event last longer than it otherwise would have, be a little more extreme, or cover a little bit larger area.” If they do exist, these sorts of intermittent influences of amplified Arctic warming on extreme winter weather in the mid-latitudes are going to be hard to pin down. In fall and early winter, it could be delayed freeze up of sea ice that is most influential, while in later winter, it could be the polar vortex. Or the influence might amplify cold extremes in one location and warm extremes in another, which over the whole mid-latitudes would cancel each other out.
In a recent paper, Overland and several co-authors argued that if Arctic warming is affecting extreme weather events in the mid-latitudes it’s through intermittent connections that amplify an extreme event only when the background atmospheric conditions are already favourable. As an example, he points to a study that described how an atmospheric river event combined with historically low November sea ice extent in the Bering and Chukchi Seas in 2017 to intensify a ridge of high pressure over the Pacific Arctic. Both up and downstream of the amplified ridge, the polar jet stream developed deep troughs, which allowed cold polar air to spill south into both East Asia and North America in early winter. “So the lack of sea ice alone doesn’t cause the events,” said Overland, “but once the background conditions are set up, the heat flux from the ice-free ocean to the atmosphere along with warm air flowing in from lower latitudes can help reinforce the jet stream high pressure areas. Maybe make a downstream cold event last longer than it otherwise would have, be a little more extreme, or cover a little bit larger area.” If they do exist, these sorts of intermittent influences of amplified Arctic warming on extreme winter weather in the mid-latitudes are going to be hard to pin down. In fall and early winter, it could be delayed freeze up of sea ice that is most influential, while in later winter, it could be the polar vortex. Or the influence might amplify cold extremes in one location and warm extremes in another, which over the whole mid-latitudes would cancel each other out.
“Every way people have tried to look at this question has produced some evidence for a connection and some evidence against a connection,” Overland said. One research team will conclude that Arctic sea ice loss is disrupting the atmospheric circulation in ways that lead to severe winters in the mid-latitudes. Another team will say that the unusual atmospheric circulation patterns come first, and drive both the warm Arctic and the cold winters over the mid-latitude continents. In Overland’s opinion, there is still not enough evidence either way to rule the hypothesis in or out. In the former case, we must not forget the fact that natural variability in September-October low around the mean clearly circulation pattern is the root cause of movement of cold into south.
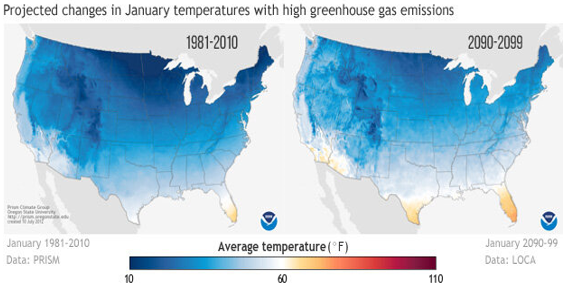
Overall, winters will be warmer in a world with continued high emissions of greenhouse gases (Figure 6). Projected changes in January average temperatures across the United States by the 2090s if the world follows a high greenhouse gas emission path (right) compared to 1981-2010 (left). Images are from Climate.gov Data Snapshots collection. Here we must remember the fact that measurements of greenhouse gases started around 1960 at few stations only and no station in Tropic and three stations in Southern Hemisphere. The carbon dioxide is one third of the Northern Hemisphere [Reddy, 2008]. So, such predictions are erroneous. This invariably represents local conditions like urban heat-island effects and night time temperature raising trend [it is clearly seen in India and China].
Niagara Falls Freezing
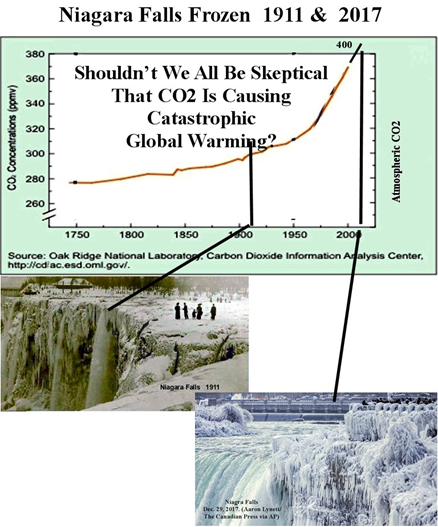
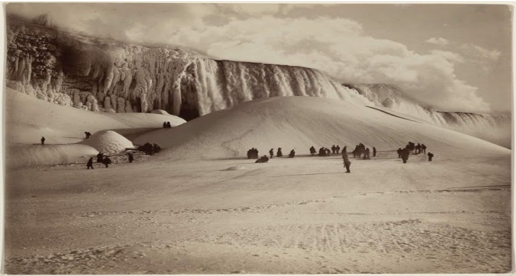
The features that became Niagara Falls were created by the Wisconsin glaciation about 10,000 years ago. The same forces also created the North American Great Lakes and the Niagara River. Freezing of Niagara Falls is common but in recent years this is attributed to global warming, a pseudo raise in temperature. This is false propaganda only. The bomb cyclone of December 2017-January 2018 over northeast USA & Canada is also attributed to global warming. Nor’easters are common to this region and this is just another “Nor’easter”. It is not even close to the blizzard of 1988. Figure 7 presents Niagara Water Falls freeze in 1911 which is worse than that of January-2018. Figure 8 presents Frozen Niagara Falls 1885. So, these clearly demonstrate the fact that there is no global warming.
The features that became Niagara Falls were created by the Wisconsin glaciation about 10,000 years ago. The same forces also created the North American Great Lakes and the Niagara River. Freezing of Niagara Falls is common but in recent years this is attributed to global warming, a pseudo raise in temperature. This is false propaganda only. The bomb cyclone of December 2017-January 2018 over northeast USA & Canada is also attributed to global warming. Nor’easters are common to this region and this is just another “Nor’easter”. It is not even close to the blizzard of 1988. Figure 7 presents Niagara Water Falls freeze in 1911 which is worse than that of January-2018. Figure 8 presents Frozen Niagara Falls 1885. So, these clearly demonstrate the fact that there is no global warming.
Lowest Temperatures in USA
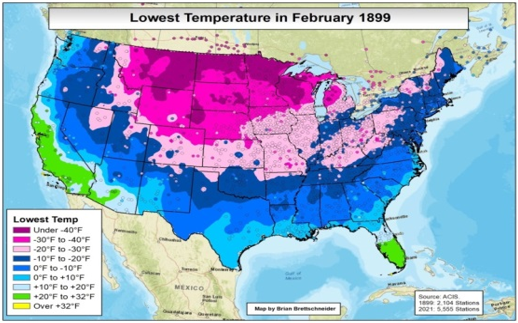
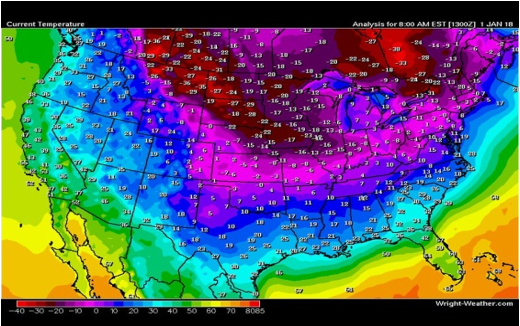
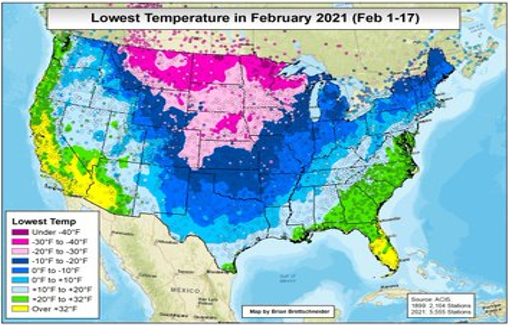
Figure 9 presents the lowest temperatures in USA upto Texas in the south in different years starting from 1899 to 2021: (a) February 1899, (b) January 1, 2018, (c) February 1-17 2021 & (d) difference between 1899 and 2021. This also clearly demostrate the fact that these are part of natural climate and nothing to do with global warming [Figure 9a & 9d].
Figure 9 presents the lowest temperatures in USA upto Texas in the south in different years starting from 1899 to 2021: (a) February 1899, (b) January 1, 2018, (c) February 1-17 2021 & (d) difference between 1899 and 2021. This also clearly demostrate the fact that these are part of natural climate and nothing to do with global warming [Figure 9a & 9d].
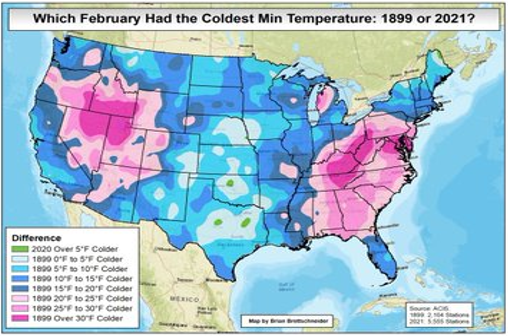
Figure d: Difference between 1899 & 2021.
Figure 9: Four cases of very cold Arctic air reaching as far southern Texas and central Florida.
Figure 9: Four cases of very cold Arctic air reaching as far southern Texas and central Florida.
Heat waves
Introduction
Every year we see numerous reports on heatwaves in summer and coldwaves in winter attributing to pseudo global warming which is an average of highs and lows over different parts of the globe. Heatwaves are not associated with temperature alone; their intensity is modified by atmospheric humidity condition prevailing at that location/region and the wind flow system. In fact this is represented by wet bulb temperature [Reddy, 1976] – presents indirectly the human comfort index. In coastal zones, the wind plays contrasting role. For example in Mumbai in the west coast with the sea breeze the impact of heatwave is reduced while in the case of Visakhapatnam in the east coast its impact is amplified. Another important component is wildfires caused by lightning, humans, etc. However, heatwaves as such are directed by general circulation pattern existing in that zone. Without this system the general conditions prevail over those zones that may not cause heatwaves.
Every year we see numerous reports on heatwaves in summer and coldwaves in winter attributing to pseudo global warming which is an average of highs and lows over different parts of the globe. Heatwaves are not associated with temperature alone; their intensity is modified by atmospheric humidity condition prevailing at that location/region and the wind flow system. In fact this is represented by wet bulb temperature [Reddy, 1976] – presents indirectly the human comfort index. In coastal zones, the wind plays contrasting role. For example in Mumbai in the west coast with the sea breeze the impact of heatwave is reduced while in the case of Visakhapatnam in the east coast its impact is amplified. Another important component is wildfires caused by lightning, humans, etc. However, heatwaves as such are directed by general circulation pattern existing in that zone. Without this system the general conditions prevail over those zones that may not cause heatwaves.
A prolonged heat wave in Siberia in 2020 is undoubtedly alarming. Reddy (2021a) presented wildfires raging across the Arctic Circle. The freak temperatures have been linked to wildfires, a huge oil spill and a plague of tree-eating moths. On global scale, the Siberian heat is helping push the world towards its hottest year on record in 2020. When averaging the global temperature, they rarely correct for such localized/regionalized factors.
Explaining heat waves and extreme temperatures
Each hemisphere of the Earth’s Atmosphere is divided into layers of cell systems that wrap around the planet broadly corresponding to a tropical layer, mid-latitude layer and a polar layer [Figure 1; Reddy, 2016]. Within each cell, air circulates as warm air raises, cools and then sinks back to the surface. Between the layers are narrow bands of strong winds, called jet stream, that act like ‘rivers’ of atmospheric circulation and control the location of storm tracks and fronts that bring rain. Typically there is a tropical jet stream at around 30° -- in India it is located around the foothills of Himalayan Mountains that drive the western disturbances; and a polar jet stream at around 60° -- Figure 3c, though they migrate, depending on the temperature gradient between the equator and the pole. The shape of the jet stream and the strength of the winds vary as the meridional temperature gradient increases or decreases. When the meridional temperature gradient reduces, weakens the jet stream allowing Rossby waves, also known as planetary waves that are formed due to the Earth’s rotation, to bend it into a meandering or wavy shape. The meanders mean warm, dry air moves northwards into the peaks, while cold, moist air moves southwards into the troughs.
Each hemisphere of the Earth’s Atmosphere is divided into layers of cell systems that wrap around the planet broadly corresponding to a tropical layer, mid-latitude layer and a polar layer [Figure 1; Reddy, 2016]. Within each cell, air circulates as warm air raises, cools and then sinks back to the surface. Between the layers are narrow bands of strong winds, called jet stream, that act like ‘rivers’ of atmospheric circulation and control the location of storm tracks and fronts that bring rain. Typically there is a tropical jet stream at around 30° -- in India it is located around the foothills of Himalayan Mountains that drive the western disturbances; and a polar jet stream at around 60° -- Figure 3c, though they migrate, depending on the temperature gradient between the equator and the pole. The shape of the jet stream and the strength of the winds vary as the meridional temperature gradient increases or decreases. When the meridional temperature gradient reduces, weakens the jet stream allowing Rossby waves, also known as planetary waves that are formed due to the Earth’s rotation, to bend it into a meandering or wavy shape. The meanders mean warm, dry air moves northwards into the peaks, while cold, moist air moves southwards into the troughs.
Warm, dry Rossby wave peaks in the jet stream can accentuate into enclosed high pressure systems, which intensify and stall as wave meandering slows. These stalled high-pressure systems are known as blocking highs, because they prevent new storm tracks and low pressure systems moving through with new jet stream meanders. Blocking highs over the Ural Mountains, Russia, and over Greenland have been associated with extreme weather in Asia and North America respectively. Stalling or blocking has occurred more frequently in recent decades and is associated with European summer heatwaves in 2003, 2006 and 2015.
The heat dome discussed in relation to late June 2021’s heatwave is probably an omega blocking high, formed as an isolated Rossby wave peak in the jet stream. The intense high pressure system extends high up into the atmosphere, trapping warm air underneath like the lid on a saucepan and further intensifying the heat through both subsidence and compressional heating. The high pressure prevents clouds from forming, which also adds to the accumulation of heat. In the case of western disturbances Reddy & Rao (1978) presented these with reference to high pressure belt stationed around Nagpur latitude.
Few cases of heat waves around the World
Introduction
Urban-heat island effect: Heatwaves are not unusual events but they are confronted with urban-heat-island effect. Unplanned growth of urban areas with slum dwellers near or within the water bodies affected more with humidity conditions. In January 2017, Chile had the most intense heatwave covered on 25, 26 January and 27, the 26th being where the highest temperatures occurred. The event was concentrated between the Metropolitan Region of Santiago and La Araucanía Region, being more intense in the region of Maule and Biobío Region. The meteorological phenomenon broke the records of maximum temperatures ever recorded in the cities of Santiago, Chillán, Concepción and Quillón, the latter being the highest maximum temperature recorded nationwide since data exists: 44.9°C (112.8°F).
Reddy (2008) discussed this issue wherein presented heat island growth in USA cities. In fact Luke Howard, an amateur meteorologist in England first recorded the heat-island effect almost 200 years ago. Beginning in 1807, he noticed London always warmer than the country, the average excess of its temperature being 1.579 degrees.
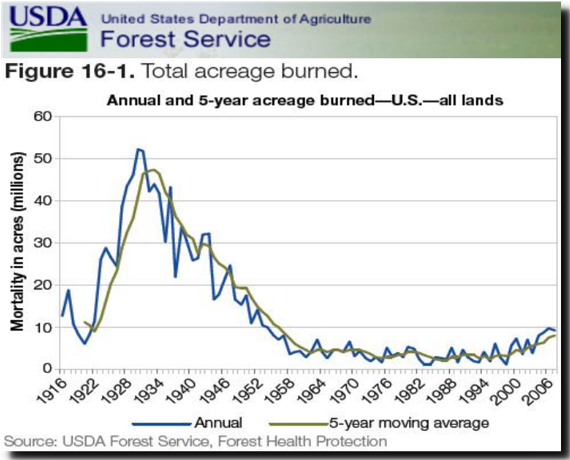
Wildfires effect: Figure 10a presents total arrearage burnt in USA during 1916-2006 [annual & 5 year moving average] wherein peak reached during1928-34. Figure 10b presents Average number of day’s per-station in each year reaching or exceeding 100oF in 982 stations of the UNHCN database during 1895-2014.
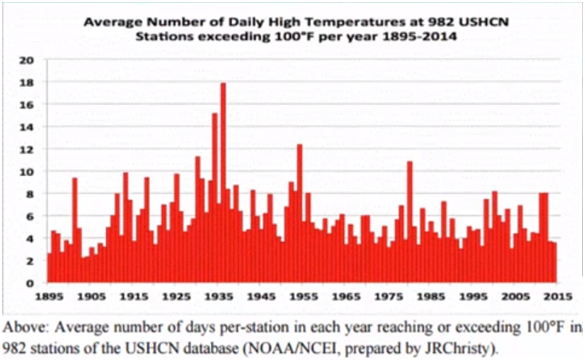
Figure 10b: Average number of day’s per-station in each year reaching or exceeding 100oF in 982 stations of the UNHCN database during 1895-2014 in US.
In Figure 10b the average number of days per-station in each year reaching or exceeding 100oF maximum matches with in Figure 10a with the peak period of arrearage burned in USA. However, forest fire burn acreage has plummeted in the US after the peak period, even as NASA claims temperatures are skyrocketing.
The 1910 Fires: In the summer of 1910, a devastating series of forest fires swept over Idaho, Montana and Washington, culminating on August 20-21 in what is known as the “Big Blowup”, coming only five years after the US Forest Service’s establishment [U.S. Forest Service History]. The 1880s brought massive fires to the Cascade Mountains. 11 Jan 1884; 12 Aug 1885; 28 Aug 1889; 18 Aug 1889; According to NASA, all of these fires occurred during the coldest years on record. There were many other low-CO2 fires in the Cascade Mountains. 22 Jun 1902.
Forest fires racing on the Pacific Coast [August 17, 1904]; 30 Aug 1915; 17 Sep 1929; 23 Jul 1933; In pre-industrial times, when CO2 was below 280 PPM, burn acreage in the US was ten times larger than now. This year has been very cool and wet in the western US, and we are having a record quiet fore season. NASA – World Began In 1979 -- August 7, 1918 – Second Hottest Day On Record In New York
A report says that Western US and Canada brace for another heatwave as wildfires spread [16th July 2021] – fires burned about 1553 sq. miles. That means wildfires are another contributor for the intensification of heatwaves. The reasons for wildfires are Multifood – dry or drought conditions, intentionally caused by humans, it is widely noted in the case of wildfires in Australia, India, etc. The raging wildfires in USA are stoked by a wave of exceptional temperatures across the western region combined with a prolonged drought that has desiccated vegetation. More than 60% of the US west is suffering exceptional or extreme drought – the highest rating since authorities began monitoring the phenomenon 20 years ago. Temperatures have also reached historic levels, with the National Oceanic and Atmospheric Administration marking 585 all-time records in the past 30 days. In addition to the hot temperatures, the sultry air mass will spur additional wildfire growth and ignition across the west, where dozens of fires are already raging. Four giant clouds forming over the Bootleg fire with the southernmost starting to mass into the most extreme fire clouds of its sort, known as a pyro-cumulonimbus. Such clouds, which occur when heat rises from a fire, can cause hail, lightning and tornadoes that can in them be extremely dangerous on the ground.
Droughts & Humidity effect: 1540 European drought – extreme drought and heatwave lasted 11 months. Heatwaves were experienced not only in Europe but also Eastern North America, centre of Argentina [Buenos Aries to Rosario] with 99°C with very high humidity -- effective temperature of 120°C. 1987. Prolonged heatwave from 20 to 31 July in Greece, the maximum temperature measured was 41.9°C (107.4°F) at 23 July at the centre of Athens and in the suburb of Nea Philadelphia, 8 kilometres (5.0 mi) northeast was 43.6°C (110.5°F) on 27 July, and were combined with high minima, with the highest being 30.2°C (86.4°F) in the centre of Athens at 27 July and 29.9°C (85.8°F) at 24 July at Nea Philadelphia. The lowest minimum was 25.6°C (78.1°F) at the centre of Athens. Moreover, humidity was high and wind speeds low, contributing to human discomfort, even during the night, 1988 – intense heat spells in combination with the drought of 1988, reminiscent of the dust bowl years caused deadly results across the United States.
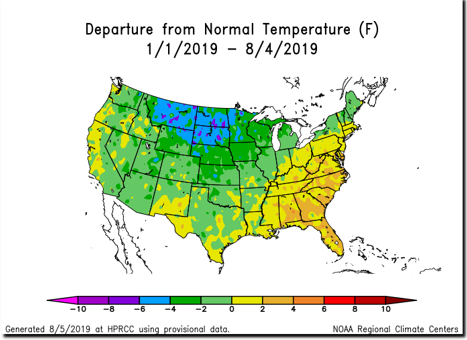
Figures 11a & b presents the (a) departure from normal temperature and (b) % of normal precipitation during 1st January to 8th April 2019. Temperature departure from normal pattern followed the % of normal rainfall over USA.
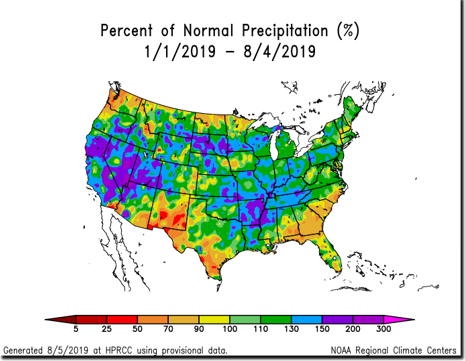
Figure 11b: Percent of Normal Precipitation (%) during 1/1/2019 – 8/4/2019 [https://hprcc.unl.edu/products/maps/acis/YearTDeptUS.png]
Land area heat waves
India: 2016 was the warmest year on record for the globe as such: 2016 Indian heatwave was a record in April and May of that year. A national record high temperature of 51.0°C (123.8°F) was set in the town of Phalodi, in the state of Rajasthan. The heat was coupled with drought which further devastation. Also, between April and May 2015, a heatwave occurred in India. Daytime temperatures hovered between 45 and 47°C (113 and 117°F) in parts of two states over the weekend, 3–7°C (5.4–12.6°F) above normal. Andhra Pradesh was hardest hit, with 1,636 people dying from the heat since mid-April, a government statement said. A further 561 people have died in neighbouring Telangana.
India: 2016 was the warmest year on record for the globe as such: 2016 Indian heatwave was a record in April and May of that year. A national record high temperature of 51.0°C (123.8°F) was set in the town of Phalodi, in the state of Rajasthan. The heat was coupled with drought which further devastation. Also, between April and May 2015, a heatwave occurred in India. Daytime temperatures hovered between 45 and 47°C (113 and 117°F) in parts of two states over the weekend, 3–7°C (5.4–12.6°F) above normal. Andhra Pradesh was hardest hit, with 1,636 people dying from the heat since mid-April, a government statement said. A further 561 people have died in neighbouring Telangana.
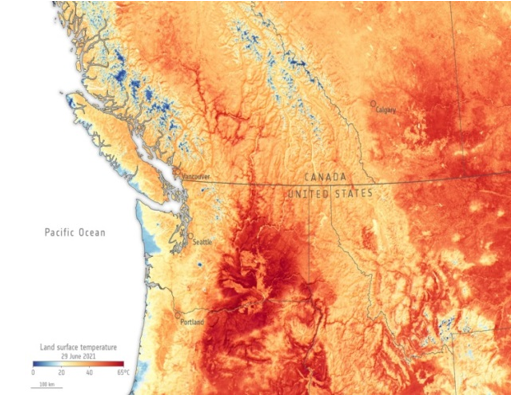
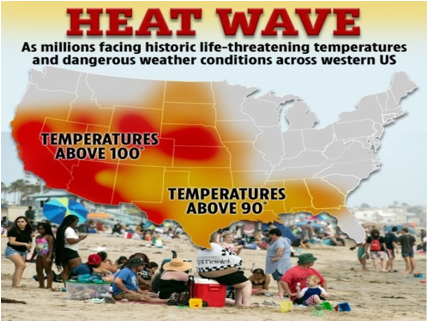
Western USA-Canada: Abnormal temperatures are happening throughout the West Coast of the United States. The Western US region is experiencing a heatwave, causing temperatures to skyrocket upwards of triple digits (Figure 12a). US-Canada heatwave seen from satellite is shown in Figure 12b. On Wednesday, June 16, 2021, on the west coast of the United States, the National Weather Service announced that over 40 million people along the coast are under a heat advisory or excessive heat warning (Figure 12c).
So far at least 11 states have reported triple digit temperatures, including: California, Nevada, Arizona, Utah, New Mexico, Colorado, South Dakota, Nebraska, Kansas, Oklahoma, & Texas. Reports stated that Phoenix, Arizona, experienced temperatures of 115°F. The city is expected to hit higher temperatures later in the week, around 117oF. Moving to Palm Springs, California, reports indicate that they have experienced temperatures of 120°F, breaking the record-high temperatures that were set back in 1961. Death Valley, California, almost broke another record on Wednesday, June 16, 2021. Their temperature was 124°F, just 10°F shy of the highest temperature recorded in that area and in the world, which was 134°F back in 1913. Denver, Colorado, also set new temperature records during this heatwave after hitting 101°F on Tuesday, June 15, 2021. The previous record set between 1952 and 1993 was 97°F.
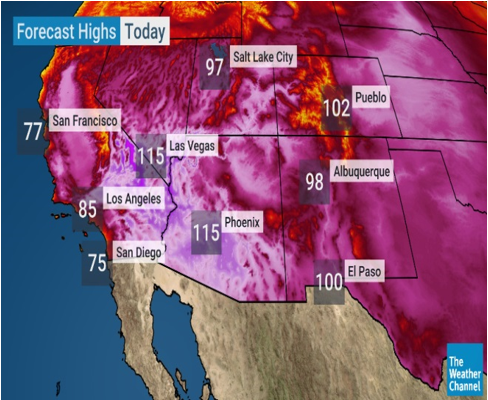
Figure 12a: Photo of some of the life-threatening temperatures occurring during the June 2021 heatwave [Credit: The Weather Channel]
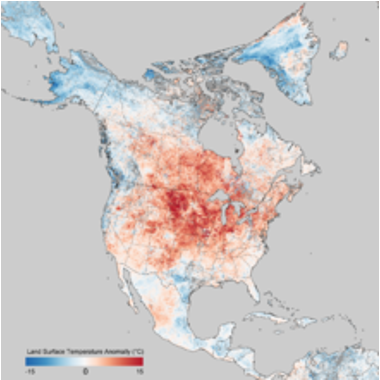
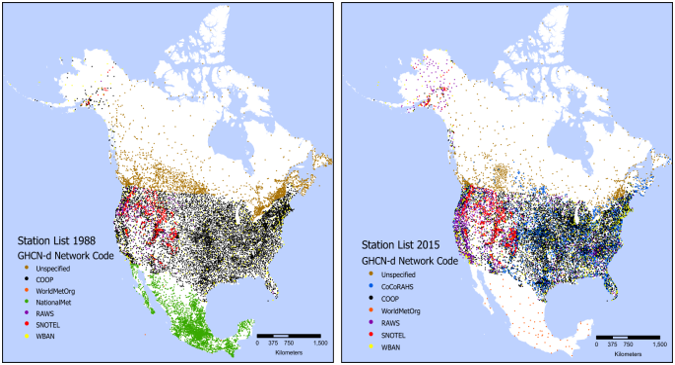
Figure 13a [Figure 13b presents the met network] presents the land surface temperatures of 8-15 March 2012 in USA.
[Land surface temperatures are distinct from the air temperatures that meteorological stations typically measure]
Argentina: The Argentina heat wave of 2013 was a historical phenomenon that occurred from 11 December 2013 to 2 January 2014 in the north and centre of the country, as well as in northern Patagonia. It was the longest heatwave experienced in Argentina since records began in 1906 affecting many cities throughout the country. For the first time since the creation of the heat alarm system, a red level alert was issued for several days consecutive for both the city of Buenos Aires and the city of Rosario, which are the cities for which the National Meteorological Service conducts heatwaves. From 11 December began to register a marked increase in temperatures, especially the maximum in a vast area of the central and northern Patagonian region, affecting southern Córdoba, southern Santa Fe, southern Entre Ríos, much of the province of Buenos Aires, La Pampa, east of Mendoza, east of Neuquén and Río Negro.
From day 19 this anomalous situation began to expand towards the north of Argentina and returned to intensify on the central part, arriving to affect to 18 provinces yielding the same towards 30 December in the central part and between 1 and 2 January in the extreme north of the country with the passage of a cold front that produced a change of mass of air. The long persistence of this heatwave (22 days) made the event an exceptional one, breaking several brands in regard to more consecutive days with minimum and maximum temperatures above the average in several meteorological stations of the affected zone. The National Meteorological Service communicated, through its daily reports, reports on the development of the heatwave. The strongest point of heat was registered in the city of Chamical, province of La Rioja with 45.5°C (113.9°F) in the city of Santiago del Estero (provincial capital) was 45°C (113°F) and in Buenos Aires (national capital) was 39°C (102°F). The extensive heatwave severely affected the health of thousands of people who needed medical assistance during those days. This is an historic heatwave.
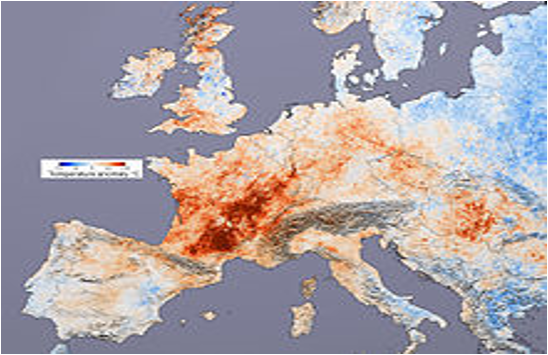
Europe: Figure 14 (a & b) present the Europe extremes during 2003 and 2015.
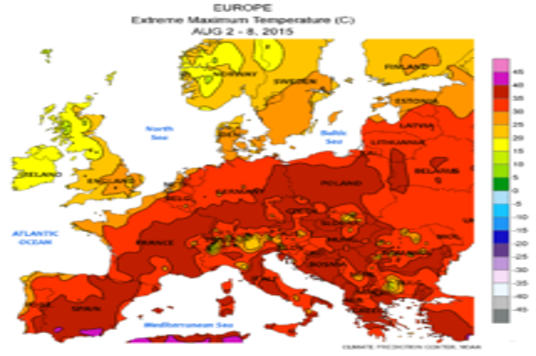
Figure 14b: Maximum temperatures from 2-8 August 2015.
[Dark red represents temperatures between 35 and 40°C]
Figure 14 (a & b): Europe typical temperature maps from Wikipedia
[Dark red represents temperatures between 35 and 40°C]
Figure 14 (a & b): Europe typical temperature maps from Wikipedia
Australia: Figure 15(a & b) presents the Australian scenario of 2012-13 & 2017. From 28 December 2012 through at least 9 January 2013 Australia has faced its most severe heatwave in over 80 years. Australia started 2013 with a record-breaking heat wave [Figure 15a]. Much of the country experienced extremely high temperatures that lasted more than two weeks. The figure also shows that over 70% of the continent recorded temperatures above 42°C, with temperatures exceeding 48°C at a number of locations. On 7 January 2013, Australia experienced its hottest day on record with a national average maximum temperature of 40.3°C. This extreme heat has also resulted in a 'flash' drought across southern and central areas of the country and has sparked several massive wildfires due to periodic high winds.
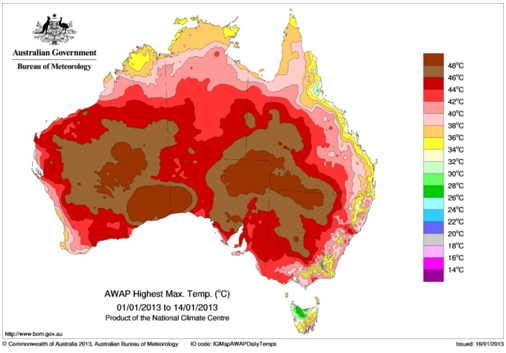
Figure 15a: Highest daily maximum temperatures during the first two weeks of January 2013. Source: Australian Bureau of Meteorology.
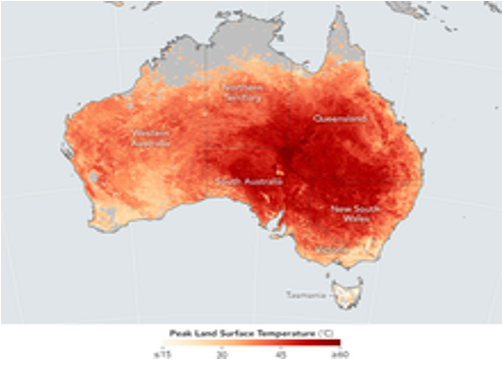
Figure 15b: Peak land surface temperature from 7-14 February 2017, as mapped by satellite during the 2017 Australian heat wave.
The heat wave had significant impact on Australia’s health, roads and railway tracks, agriculture and the environment. The question that many people are asking is whether this level of extreme heat is linked to climate change. While Australia has always experienced heat waves, this particular event was very unusual as the extreme temperatures were widespread and persisted for a long time. This is not so, see Figure 13b, where the heatwave in 2017 is weaker than 2013.
New Zealand: In New Zealand, the weather condition making the headlines in early 2013 was drought. Over the period January to March 2013 the North Island experienced an average of almost 80 days without rain, far more than ever recorded previously. The Figure 16 illustrates the situation on 17 March 2013, approximately the peak of the drought. It shows the soil moisture deficit, (defined as incoming rainfall minus outgoing evapotranspiration). Red shading indicates the very driest areas – soil moisture deficits greater than 130mm.
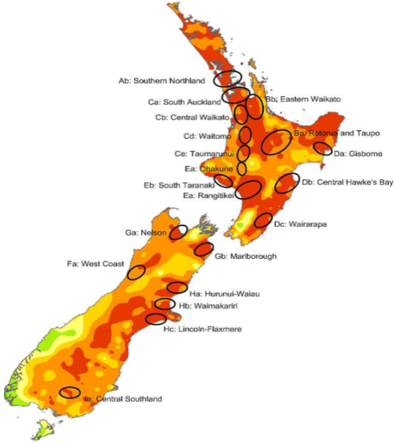
Figure 16: Soil moisture deficit across New Zealand on 17 March 2013, probably the point in the drought when soils were at their driest. Circled areas indicate sample locations analysed in the NIWA (2013) report from which the figure is taken.
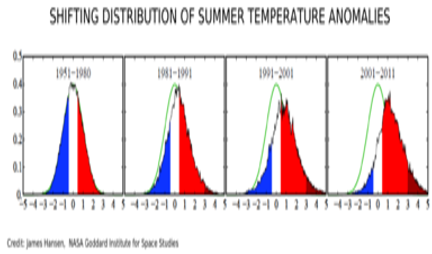
An argument was put forth that a warming climate can change the frequency, intensity and duration of extreme hot weather. A shift in warming climate is shown in Figure 17a & b. For drought, we might envisage an analogous picture but with an index that measures drought such as the total number of dry days in a given period. When the average temperature is increased by a small amount, the effect on the tail ends of the temperature range (the ‘extremes’) is pronounced. This means that the likelihood of extreme cold weather goes down while the likelihood of extreme hot weather goes up. In addition, new record hot weather and heat waves occur after the shift in the climate to a warmer state. Shifting of distribution of summer temperature anomalies as projected are not realistic picture. Increasing trend is primarily associated with increasing trend in minimum temperature and thus such shift has no relevance in heatwaves in true sense. Also, the raise in temperature during drought will not be same at all places as soil modifies it.
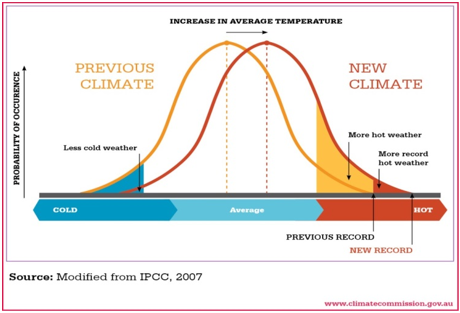
Figure 17b: The effect of changes in temperature distribution on extremes. Source: Australian Climate Commission (closed by the Australian government in October 2013).
Summer & winter heat waves
It may never be possible to say that any specific extreme weather event was caused by human-induced climate change alone, in the sense that, without climate change, that event would not have happened. We can, however, ask the question how the odds of getting an extremely hot summer, or extremely severe drought, have changed due to man-made climate change: have past greenhouse gas emissions and other forms of pollution “loaded the weather dice” towards (or perhaps even away from) events of this nature? Contrary to this we have seen in Australia heat in 2013 and 2017. So there is no role for the man-made climate change.
It may never be possible to say that any specific extreme weather event was caused by human-induced climate change alone, in the sense that, without climate change, that event would not have happened. We can, however, ask the question how the odds of getting an extremely hot summer, or extremely severe drought, have changed due to man-made climate change: have past greenhouse gas emissions and other forms of pollution “loaded the weather dice” towards (or perhaps even away from) events of this nature? Contrary to this we have seen in Australia heat in 2013 and 2017. So there is no role for the man-made climate change.
Europe’s winter heat wave: Around mid-February 2021, a jet-stream of Sahara dust brought a winter heatwave in Europe with daily temperatures nearly similar to maximum high during spring. In Berlin, a high temperature of 20°C (68°F) was reported on Wednesday and the next day it reached 19°C (66°F). Paris reported the same high temperature of 20°C (68 °F) while Warsaw and London had it around 18°C (64°F). In Asia, a record-high winter temperature was declared in Beijing on February 21 at 25.6°C (78.1°F).
New Zealand’s winter heat waves: New Zealand recorded winter heatwave during June-July 2021 and summer heatwave during 2017-18.
Winter heat wave – June-July, 2021: New Zealand has just experienced its warmest June and July since records began in 1909 and is on track for its second successive warmest winter on record. Data from the National Institute of Water and Atmospheric Research's (NIWA) seven-station temperature series showed on Thursday that the temperature for the past two months was an extremely high 1.53 degrees Celsius above the long-term average. NIWA meteorologist Ben Noll said the previous record was 1.15 degrees Celsius above average for June and July in 2016. "There have been a number of factors which have contributed to the warmer temperatures. Air pressure has been higher than normal in the east so far this winter which has brought more north-easterly winds to New Zealand bringing warmer air from the sub-tropics." Sea temperatures around the coast have also been warmer than average, modifying colder air masses tracking towards New Zealand. Noll also said the Southern Hemisphere polar vortex above Antarctica has been stronger than normal. "This helps keep filaments of frigid air tucked away deep in the Southern Ocean."
Atmospheric patterns have also leaned towards a La Niña-like direction, which tends to produce warmer conditions in the southwest Pacific. Another climate driver in the Indian Ocean, called the Indian Ocean Dipole, developed during July and played a role in the atmospheric river that brought flooding to the Buller district as well as extra warmth and humidity. Meanwhile, the warmer temperatures have resulted in more rain and less snow at lower elevations where rain has played havoc with some ski fields. Hydrological forecaster Jono Conway said most of the NIWA snow monitoring stations between 1,800 and 2,000 meters of elevation were experiencing average or above-average snow levels for the time of year but sites at lower elevations had little or no snow. Apart from sites in Canterbury that received a large dump of snow at the tail end of the May flood event, most of the snow has come from a few big events in early- to mid-July. "The warm temperatures have been causing the precipitation to fall as rain at lower elevations, which makes it very difficult for ski fields with bases at lower elevations, particularly club fields with no snow making." July in particular featured above or well above normal rainfall in the interior and western South Island, with Mount Cook recording 146 percent of its monthly normal rainfall and Arthur's Pass on 181 percent. Monthly temperatures were 1.7 degrees Celsius and 1.9 degrees Celsius above average, respectively, illustrating that the rain/snow zone sat at a higher altitude than normal. Noll said with the June and July temperatures tracking so far above average, this winter had a firm lead on last year's figures. "This is consistent with our expectations. In the background, the long-term tailwind of climate change continues to churn. Of the seven warmest June and Julys, six have occurred since 2000," Noll said.
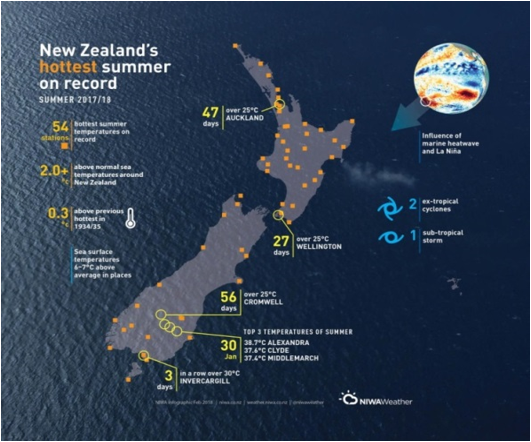
New Zealand’s summer heat wave of 2017-18 [Figure 18]
The 2017/18 summer records, 54 stations across New Zealand recorded their hottest summer on record, 39 their second-hottest and nine their third-hottest. In Alexandra on 30 January the temperature reached 38.7°C. On the same day Clyde got to 37.6, Middlemarch 37.4 – together these comprise the hottest temperatures of summer. Wellington had 27 days above 25°C – the average is two. Auckland usually has 29 summer days above 25°C (measured at Auckland Airport), this year there were 47 – the highest since records began at Auckland Airport in 1966. Invercargill recorded three consecutive days over 30°C in January. It’s never done that for two days in a row, let alone three. Cromwell topped 25°C for 56 days – normal is 35 days. Dew point temperature – the meteorological measurement combining humidity and temperature – failed to drop below 19°C in Auckland between 10 and 15 February, making it a rare 115-hour period of very high humidity. In Wellington a dew point temperature of 22°C was recorded at 6pm on 11 February, the highest dew point on record for the city. Mahia, Appleby and Waipara West had their wettest summers on record.
Marine heat wave
The ocean around New Zealand is getting warmer, and extreme warming events have become more frequent over the past years. It revealed that most coastal areas around New Zealand were warmer than normal during this last winter (June to August 2021), as highlighted in the Figure 19 showing the difference between winter 2021 average sea surface temperatures and the climatology (daily mean values based on data from 25 years).
The ocean around New Zealand is getting warmer, and extreme warming events have become more frequent over the past years. It revealed that most coastal areas around New Zealand were warmer than normal during this last winter (June to August 2021), as highlighted in the Figure 19 showing the difference between winter 2021 average sea surface temperatures and the climatology (daily mean values based on data from 25 years).
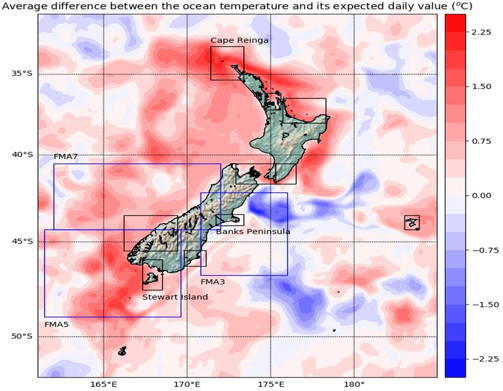
Figure 19: Temperature anomaly in relation to 25 years of climate data. The boxes show the regions where detailed analysis and detection of marine heatwaves is carried out.
In late spring and early summer an area of high pressure was almost stationary over New Zealand and the Tasman Sea, bringing plenty of sun and very warm conditions for the time of year. That heated the top of the Tasman Sea and New Zealand’s coastal waters and, because there weren’t many storms, there was limited mixing and churning of the ocean. That meant that the colder water under the sea’s surface did not come up to the top to mix with the warmer water. From there occurred what meteorologists call “positive feedback” – the warmth of the ocean fed the warmth on land and that in turn kept the seas warmer than average. In addition, warmer northerly winds, a characteristic of a La Niña weather pattern, pushed warm water towards New Zealand and generally kept temperatures warmer than average. Causes for such scenarios are persistent patterns of high pressure over the Tasman Sea and New Zealand, La Niña's influence of warm north-easterly winds & a persistently positive Southern Annular Mode (SAM), which limited southerly wind outbreaks. NIWA climate scientists have had to go back more than 80 years to find a summer that resembled anything like the one we have just sweated through. They found it in the summer of 1934/35.
Conclusions
Main Conclusion: April-May-June the year to year changes were the lowest for Acetic (a) Sea Ice Extent & Ice Volume. That shows there is no global warming.
Other Conclusions: This is in continuation of Part-I [Disturbances Recorded in Bay of Bengal & Arabian Sea: A Note.] (Reddy, 2021b), wherein covered principal rainy periods, namely pre-monsoon, monsoon, post-monsoon]. Now the present article presented the coldwaves/winter rains and heatwaves not only Indian scenario but also around the world scenarios. They are part of localized general circulation patterns in any given part of the globe. Unlike coldwaves/winter rains, heatwaves are modified by several localized conditions such as wildfires, humidity conditions, wind conditions [other than GCP]. These form worldwide phenomenon. These must be studied at locat and regional level by taking in to account Climate system [Reddy, 2016]. Simly generalization is dangerous.
In conclusion, the word “global warming” is a misnomer. Trend in temperature presents increasing, decreasing and no change at local and regional levels based on sevral location specific factors. The temperature varies with soil type, the heating of soil is different over the water. With the population growth land use and land cover changed drastically that impact local temperature.
Carbon Dioxide [CO2] is not a” pollution” but it is part of air in the atmosphere. We inhale air, use oxygen and release CO2 back in to the atmosphere. The CO2 since 1960 [around this time measurements started] presented a linear increase with population. In the Southern Hemisphere CO2 is around one-third of that in the Northern Hemisphere and so also the population in Southern Hemisphere is lower than Northern Hemisphere. By controlling population we can bringdown CO2 in the atmosphere. According to IPCC’s AR6-WG-I, gglobal warming of 1.5°C and 2.0°C will be exceeded during the 21st century unless deep reductions in CO2 and other greenhouse gas emissions occur in the coming decades. This is the conclusion from the 1300 pages report and this is a qualitative statement and not based on science. Here, the other greenhouse gases have shorter life span in the atmosphere and the contribution to it is negligible unlike CO2 with more than 1000 years of lifespan in the atmosphere.
The entire issue runs around “there is an increasing greenhouse gas and they are contributing to rise in temperature”. However, since 2000 they are struggling to get a scientifically defined value for “Climate Sensitivity Factor” that defines the link between greenhouse gases and temperature. They are following trial and error approach with no real solution. With this knowledge scientific groups (?) have been attributing everything to global warming; one such issue is coldwaves and heatwaves. In fact they are associated with general circulation patterns such as western disturbances in India and polar-vortex – jet stream in mid-latitudes. In the case of India, low pressure systems in Arabian Sea and Bay of Bengal play important role in driving the wind flow.
In the case of coldwaves few most important points observed by the author in this study are in the case of mid-latitudes: (a) Though Arctic Sea extent during minimum present high year to year variations but conspicuously there is no such change during April-May-June and maximum is close to it; (b) Niagara Water Falls showed worse scenario of Freezing in the past [1885, 1911] compared to current [January 2018]; and (c) The lowest temperatures in USA reaching up to Texas in the south present existence of such scenarios starting from 1899 to 2021.
In the case of heatwaves, in addition to summer heatwaves, Europe and New Zealand experienced winter heatwaves for different reasons. In the case of New Zealand marine heatwave condition is also recorded. Summer heatwaves in additional to circulation patterns, localized/regionalized conditions also causing heatwaves, namely urban-heat-island effect, wildfires effect, droughts and humidity effect, etc. all these are nothing to do with the global warming but people put it as an adjective.
Acknowledgements
The research is self-funded. The author expresses his grateful thanks to those authors whose work was used for the continuity of the story. The author also confirms there is no conflict of interest involve with any parties in this research study.
The research is self-funded. The author expresses his grateful thanks to those authors whose work was used for the continuity of the story. The author also confirms there is no conflict of interest involve with any parties in this research study.
References
- BRS (British Royal Society) & USNAS (United States National Academy of Sciences) (2014): Climate Change – Evidence and Causes.
- De, U.S., Dube, R.K. & Rao, G.S.P., (2005): Extreme weather events over India in the last 100 years. J. Indian Geophys. Union, 9 (3):173-187.
- Philip, N.M. & Reddy, S.J., (1974): Effect of radiation on human comfort. Indian J. Met. Geophys., 25 (3&4):433-440.
- Reddy, S.J. & Jayanthi, S., (1974): Effect of air pollution on radiation and human comfort over six Indian stations. Indian J. Met. Geophy., 25 (3&4):441-444.
- Reddy, S.J., (1974): Effective pollution potential over ten Indian stations. Indian J. Met. Geophy., 25(3&4):445-448.
- Reddy, S.J., (1976): Wet bulb temperature distribution over India. Indian J. Met. Hydrol. Geophys. 27(2):167-171.
- Reddy, S.J. & Rao, G.S.P., (1978): A method of forecasting the weather associated with western disturbances. Indian J. Meteorol., Hydrol. Geophy. 29:515-520.
- Reddy, S.J., (1993): Agroclimatic/Agrometeorological Techniques: As applicable to Dry-land Agriculture in Developing Countries. www.scribd.com/Google Books, 205p; Book Review appeared in Agricultural and Forest Meteorology, 67 (1994): 325-327.
- Gupta, R.K. & Reddy, S.J. (Eds.), (1999): Advanced technologies in meteorology. Tata McGraw-Hills Publ. Comp. Ltd., New Delhi, India, 549p.
- Reddy, S.J., (2002): Dry-land Agriculture in India: An Agroclimatological and Agrometeorological Perspective. BS Publ., Hyderabad, 429p.
- Reddy, S.J., (2008): Climate Change: Myths & Realities. www.scribd.com/Google Books, 176p.
- Reddy, S.J., (2016): Climate Change and its Impacts: Ground Realities. BS Publ., Hyderabad, India, 276p.
- Reddy, S.J., (2019a). Agroclimatic/Agrometeorological Techniques: As applicable to Dry-land Agriculture in Developing Countries [2nd Edition]. Brillion Publishing, New Delhi, 372p.
- Reddy, S.J., (2019b): Workable “Green” Green Revolution: A Framework [Agriculture in the perspective of climate change]. Brillion Publishing, New Delhi, 221p.
- Reddy, S.J., (2019c): Water Resources Availability over India. Brillion Publishing, New Delhi, 224p.
- Reddy, S.J., (2021a): Agro-meteorology: An Answer to Climate Crisis, Brillion Publ., New Delhi, 242p.
- Reddy, S.J., (2021b): Disturbances Recorded in Bay of Bengal & Arabian Sea: A Note. Journal of Agriculture and Aquaculture 3(2), 14p.
- WMO [World Meteorological Organization), (1966): Climate Change. Geneva, Switzerland, WMO Tech Note 79, WMO, 195 TP 100, pp. 81, (Prepared by J.M. Mitchel, B. Dzerdzeevskii, H. Flohn, W.L. Hofmeyer, HH. Lamb, K.N. Rao & C.C. Wallen).
Citation: Dr. S. Jeevananda Reddy. (2022). A Note on “Coldwaves & Heatwaves”: Disturbances [Part-II]. Journal of Agriculture and Aquaculture 4(1).
Copyright: © 2022 S. Jeevananda Reddy. This is an open-access article distributed under the terms of the Creative Commons Attribution License, which permits unrestricted use, distribution, and reproduction in any medium, provided the original author and source are credited.

