Research Article
Volume 3 Issue 1 - 2021
Assessment of the Ameliorative Roles of Vitamins A, C and E on Morphometric Parameters of Clarias Gariepinus (Burchell, 1822) Fingerlings Exposed to Cadmium Choride
1Fisheries and Hydrobiology Unit, Department of Animal Biology, Federal University of Technology, Minna, Niger State.
2Biochemistry Deparment, Federal University of Technology, Minna, Niger State.
2Biochemistry Deparment, Federal University of Technology, Minna, Niger State.
*Corresponding Author: Samuel PO, Fisheries and Hydrobiology Unit, Department of Animal Biology, Federal University of Technology, Minna, Niger State.
Received: February 08, 2021; Published: February 19, 2021
Abstract
Environmental pollution in the form of Cd is a major environmental problem arising mostly from anthropogenic activities all over the world causing both health and economic loses either in the short- or long-run. The roles of vitamins in mitigating the effects of Cd toxicant in term of morphological differentiation were investigated. Clarias gariepinus fingerlings (whose initial weight ranged from 3-11g, standard length ranged from 7.9-9.4cm and total length ranged from 8.9-10.9cm) were exposed to sub-lethal concentrations of Cd(00, 12mg/L, 16mg/L, 20mg/L and 24mg/L) with replicate in each case. Minimum concentration of the toxicant was taken as the concentration for each of the vitamins and administered to all treatments. The morphometric parameters measured on weekly basis for a period of 12 weeks were standard lengths (SL), total lengths (TL) and weight from 2 randomly selected samples from each treatment and replicate. Fresh concentrations of the toxicant and vitamins were prepared and administered every 72 hours following standard procedures when the water was changed. The various treatments group include Cd (Cd only with T1-T4 and replicates), CdVA (Cd+vitamin A with T1-T4 and replicates), CdVC ((Cd+vitamin C with T1-T4 and replicates) and CdVE (Cd+vitamin E with T1-T4 and replicates). The weight derivatives such as specific growth rate (SGR), weight gain (WG) and % weight gain (% WG) were also calculated at the end of the exposure periods. Length-weight regression analysis as well as one way ANOVA was used to establish relationships. From the results: The highest SL in Cd only treatments was recorded in T1 at the 5th week with 10.50cm. The samples exposed to CdVA exhibited slow growth through-out the exposure period. The highest SL in CdVC treatments was recorded at week 8 in T1 with 10.60cm. There were sight general improvements in growth in this case. The maximum SL in CdVE were obtained in T2 with 10.70cm at the 7th and 8th week of exposure. The highest TL in samples exposed to Cd treatments was recorded at the 5th week in T2 with 11.80cm.There was general poor performance in the total TL when compared with the control samples. In CdVA the highest was also recorded in T1 with 10.90cm at the 1st week after exposure.The maximum TL in samples subjected to CdVC was 12.30cm in T1 at the 1st week. CdVE treatments recorded 12.40cm as the highest in T2 at the 7th week. Samples exposed to Cd treatments had the highest weight of 13.81g in T1 at the 5th week of exposure. There was also general decline in weight especially at the later stages. The highest weight obtained in samples exposed to CdVA treatments was 9.54g in T2 at the 3rd week of exposure. The samples exposed to CdVC treatments indicated that the highest weight was recorded in T3 at the 7th week with 13.13g. The maximum weight obtained in samples exposed to CdVE treatments was 15.43g in T2 at the 7th week of exposure; negative %WG and low values of SGR were also recorded. The relationships between length and weight of C. gariepinus were linear throughout the period of exposure in all Cd treatment groups. T2 samples in all Cd treatment groups had the highest R2 values (0.6796) with the exception of CdVE treatments. The outcome of this research suggests that CdCl2 is very deleterious and higher concentrations of the vitamins may be required in attenuating the effects of the toxicant given that there were sight improvements in treatments with vitamins.
Keywords: Cadmium; Ameliorative roles; Length-weight relationship; Morphometric parameters; Vitamins; Weight derivatives
Introduction
The African cat fish, Clarias gariepinus is a tropical hardy species belonging to the Phylum Chordata, class Actinopterygii and family Clariidae. Clarias species is a widely distributed fish in Asia and Africa. In these areas, the fish is extremely popular on account of its tasty flesh, its unparalleled hardness, its rapid growth and its somewhat acceptable market price (FAO, 2003). In Nigeria, Clarias species is an indigenous fish occurring in freshwater throughout the country. It is suspected that apart from tilapia, Clarias (cat fish) is the most abundant cultivated fish species in Nigeria (FAO, 2003). The common species found are Clarias gariepinus, Clarias anguillaris, Clarias buthupogon and Clarias lazera.
Heavy metals could be essential or non-essential. Heavy metals such as Fe, Cu, Zn, Ni, Co, Cr, and Mn are vital to human only at lower concentrations, but they become more toxic when they are taken up more than the bio-recommended limits (Shilpi et al., 2015). It is also known that even essential metals may be toxic on the biological activities of organisms above certain concentrations (Merciai et al., 2014).
Fish are particularly vulnerable and heavily exposed to pollutants due to feeding and living in aquatic ecosystems, because they cannot avoid pollutant harmful effects (Ahmed et al., 2020). Heavy metals enter ?sh by direct absorption from water through their gills and skin, or by ingestion of contaminated food (Ayyat et al., 2020).
Little is known about the influence or effects of Cd as well as the supplemented treatments with vitamins on the growth parameters of Clarias gariepinus as morphological manifestations of the physiological changes taking place in the organism due to the presence of the toxicants and vitamins. Osfor et al. (2010) demonstrated that vitamin E could improve daily food intake, body weight gain and feed efficiency ratio. Also, bioaccumulation pattern of cadmium and lead in the head capsule and body muscle of Clarias gariepinus exposed to paint emulsion effluents indicated that fish can bioaccumulate these metals from a polluted environment which can culminate in the reduction or impaiment of natural population size; and could be sources of these metals to man (Dahunsi et al., 2012) with deleterious effects over a long period of time since among all the heavy metals, Cd, arsenic, mercury and lead pose highest degree of toxicity and that is of great concern to plants and human health (Athar et al., 2018). In addition, Witeska et al. (2014) studied the effects of Cd (100 μg/L) on the embryonic, larval or both stages of the ide (Leuciscus idus). Their results showed that metal toxication affected mortality, body size, various body morphometrics and deformities (vertebral curvatures and yolk sac deformities). This study therefore, attempted to determine the effects of the specific toxicants of interest on the growth parameters of C. gariepinus and to what extent such effects can be abated or reduced in the presence of vitamin supplements.
Materials and Methods
Samples/materials collection and Acclimatization
A total number of six hundred and fifty (650) fingerlings of Clarias gariepinus were purchased from a commercial fish farmer and transported in 50L containers filled with water to the Old Farm Research Unit of the Department of Water, Aquaculture and Fisheries Technology, Bosso Campus, Federal University of Technology, Minna, Nigeria. The fishes were placed in fish ponds with water for acclimatization. The fishes were fed twice daily (morning and evening) with Blue Crown feed (3mm) for 14 days (2 weeks) for the acclimatization. The holding water was changed every three days during the period.
A total number of six hundred and fifty (650) fingerlings of Clarias gariepinus were purchased from a commercial fish farmer and transported in 50L containers filled with water to the Old Farm Research Unit of the Department of Water, Aquaculture and Fisheries Technology, Bosso Campus, Federal University of Technology, Minna, Nigeria. The fishes were placed in fish ponds with water for acclimatization. The fishes were fed twice daily (morning and evening) with Blue Crown feed (3mm) for 14 days (2 weeks) for the acclimatization. The holding water was changed every three days during the period.
The vitamins A, C and E granules or pellets were purchased from commercial chemical stores. The toxicant, Cd (100g) analar grades were purchased from commercial chemical stores and stored in a cool dry condition throughout the period of the experiment. This toxicant was administered according to the sub-lethal concentrations of the treatments during the chronic phases of the exposure.
Experimental Set-up
Five treatments including control with replicate in each treatment were set-up for the Cd, Vitamin A, C and E; and the sub-lethal exposures (00 as control, 12mg/L as T1, 16mg/L as T2, 20mg/L as T3 and 24mg/L asT4 representing 15, 20, 25 and 30% LC50 of Cd, respectively) were run for a period of twelve (12) weeks. Sampling was made from each trough randomly on a weekly basis for the twelve weeks. The vitamin supplements (in each case) were taken same as the lowest concentration of the toxicant and administered uniformly in every treatment. The first group of treatments was tagged Cd (Cd only with T1-T4 and replicates), second CdVA (Cd+vitamin A with T1-T4 and replicates), third CdVC (Cd+vitamin C with T1-T4 and replicates) and fourth CdVE (Cd+vitamin E with T1-T4 and replicates).
Five treatments including control with replicate in each treatment were set-up for the Cd, Vitamin A, C and E; and the sub-lethal exposures (00 as control, 12mg/L as T1, 16mg/L as T2, 20mg/L as T3 and 24mg/L asT4 representing 15, 20, 25 and 30% LC50 of Cd, respectively) were run for a period of twelve (12) weeks. Sampling was made from each trough randomly on a weekly basis for the twelve weeks. The vitamin supplements (in each case) were taken same as the lowest concentration of the toxicant and administered uniformly in every treatment. The first group of treatments was tagged Cd (Cd only with T1-T4 and replicates), second CdVA (Cd+vitamin A with T1-T4 and replicates), third CdVC (Cd+vitamin C with T1-T4 and replicates) and fourth CdVE (Cd+vitamin E with T1-T4 and replicates).
Determination of Growth Parametersof Clarias gariepinus exposed to sub-lethal concentration of lead and cadmium
Standard length
At every sampling day 2 randomly selected specimens were taken from each of the sub-lethal concentration exposure and replicate including the control for the determination of the standard length in centimeters. The standard length was measured from the tip of the snout (face bone) to the tail lobe (caudal peduncle) using a metre rule graduated in centimetres.
Total length
The total length of two randomly selected fish samples from each treatment and replicate including the control were taken at each sampling day of the chronic exposure. The total length was measured from the tip of snout to the end of the tail fin using metre rule graduated in centimetres.
The total length of two randomly selected fish samples from each treatment and replicate including the control were taken at each sampling day of the chronic exposure. The total length was measured from the tip of snout to the end of the tail fin using metre rule graduated in centimetres.
Weight
The weight of the fish was recorded using the electronic battery powered weighing balance (Digital Pocket Scale, 2*PCS, 3V AAA batteries). The fish was weighed in gram by placing them inside a basket whose weight has been taped to zero in order to get the actual weight of the fishes. The weight of the fish sample was determined from two randomly selected specimens from each treatment and replicate including the control. The specimen was weighed separately and the average taken to represent each treatment and replicate at each sampling day. From the measurements the following parameters were determined:
The weight of the fish was recorded using the electronic battery powered weighing balance (Digital Pocket Scale, 2*PCS, 3V AAA batteries). The fish was weighed in gram by placing them inside a basket whose weight has been taped to zero in order to get the actual weight of the fishes. The weight of the fish sample was determined from two randomly selected specimens from each treatment and replicate including the control. The specimen was weighed separately and the average taken to represent each treatment and replicate at each sampling day. From the measurements the following parameters were determined:
Weight gain
The fish weight gain (WG) was calculated as the difference between the finalweight of fish at the end of the experiment and the initial weight in grams (Ahmed, 2012).
The fish weight gain (WG) was calculated as the difference between the finalweight of fish at the end of the experiment and the initial weight in grams (Ahmed, 2012).
Percentage weight gain (%)
The Percentage weight gain was calculated as described by Ahmed (2012) thus:
The Percentage weight gain was calculated as described by Ahmed (2012) thus:
Weight gain (%) = Final body weight – initial body weight X100
Initial body weight
Initial body weight
Specific growth rate
The specific Growth Rate (SGR) was calculated using the formula;
SGR= (lnW2-lnW1) X100
(T2-T1)
The specific Growth Rate (SGR) was calculated using the formula;
SGR= (lnW2-lnW1) X100
(T2-T1)
Where W1 = initial weight, W2 = Final weight, T2-T1 = Number of days of exposure.
Data Analysis
Length-Weight Relationship was determined using regression analysis and one way analysis of variance (represented graphically) using SPSS, version 20.
Length-Weight Relationship was determined using regression analysis and one way analysis of variance (represented graphically) using SPSS, version 20.
Results and Discussions
Growth parameters of C. gariepinus exposed to sub-lethal concentrations of Cd toxicant and their respective supplemented treatments with Vitamins A, C and E
Standard Length of C. gariepinus exposed to sub-lethal concentrations of Cd toxicant and their respective supplemented treatments with Vitamins A, C and E
Standard Length of C. gariepinus exposed to sub-lethal concentrations of Cd toxicant and their respective supplemented treatments with Vitamins A, C and E
The standard length of samples exposed to Cd treatments displayed general decline in growth of the fish. The highest standard length was recorded in T1 at the 5th week with 10.50cm while the lowest was also recorded in T1 with 7.10 cm at the 12th week. (Figure 1).
The samples exposed to CdVA exhibited slow growth. The highest standard length was recorded in T1 with 9.60cm after the 1st week of exposure; while the lowest were recorded in T4 and T3 at the 7th and 8th week, respectively with 7.00cm. (Figure 2).
The highest standard length in CdVC treatments was recorded at week 8 in T1 with 10.60cm while the lowest were recorded at the 7th and 8th in T2 and T3, respectively with 7.50cm. There were slight general improvements in growth when compared to what were obtainable in CdVA treatments. (Figure 3).
The maximum standard lengths in CdVE were obtained in T2 with 10.70cm at the 7th and 8th week of exposure; while the lowest was recorded in T4 at the 6th week with 7.00cm. (Figure 4).
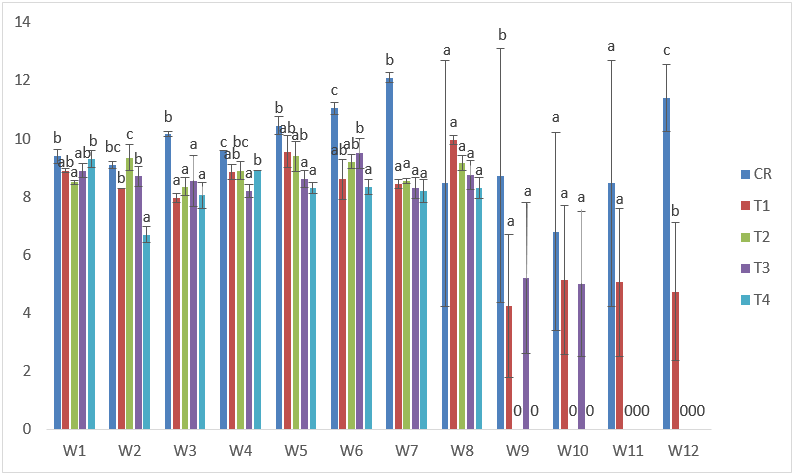
Figure 1: Mean values of standard lengths of C. gariepinus exposed to sub-lethal concentrations of Cd for a period of 12 weeks.
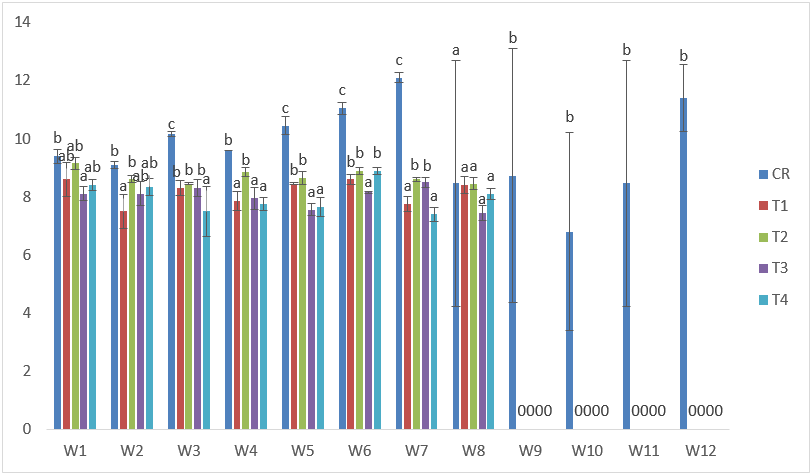
Figure 2: Mean values of standard lengths of C. gariepinus exposed to sub-lethal concentrations of Cd supplemented with vitamin A for a period of 12 weeks.
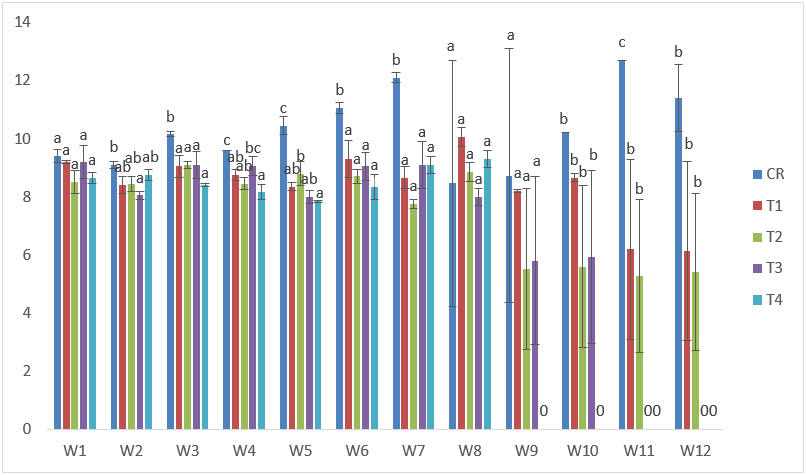
Figure 3: Mean values of standard lengths of C. gariepinus exposed to sub-lethal concentrations of Cd supplemented with vitamin C for a period of 12 weeks.
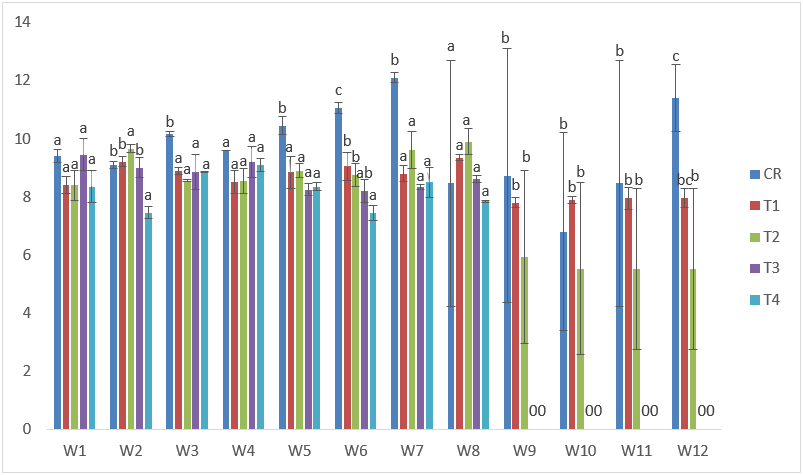
Figure 4: Mean values of standard lengths of C. gariepinus exposed to sub-lethal concentrations of Cd supplemented with vitamin E for a period of 12 weeks.
Total Length of C. gariepinus exposed to sub-lethal concentrations of Cd toxicants and their respective supplemented treatments with Vitamins A, C and E
The highest total length in samples exposed to Cd treatments was recorded at the 5th week in T2 with 11.80cm; while the lowest was recorded in T1 at the 12th week with 8.20cm. There was general poor performance in the total length when compared with the control samples. (Figure 5).
The highest total length in samples exposed to Cd treatments was recorded at the 5th week in T2 with 11.80cm; while the lowest was recorded in T1 at the 12th week with 8.20cm. There was general poor performance in the total length when compared with the control samples. (Figure 5).
The lowest total length in samples exposed to CdVA was 7.40cm in T1 at the 2nd week after exposure while the highest was also recorded in T1 with 10.90cm at the 1st week after exposure. (Figure 6).
The maximum total length in samples subjected to CdVC was 12.30cm in T1 at the 1st week, while the lowest was obtained in T4 after the 2nd week of exposure with 8.40cm. (Figure 7).
CdVE treatments recorded 12.40cm as the highest in T2 at the 7th week, while the lowest was recorded in T4 at the 6th week of exposure with 8.00cm. (Figure 8).
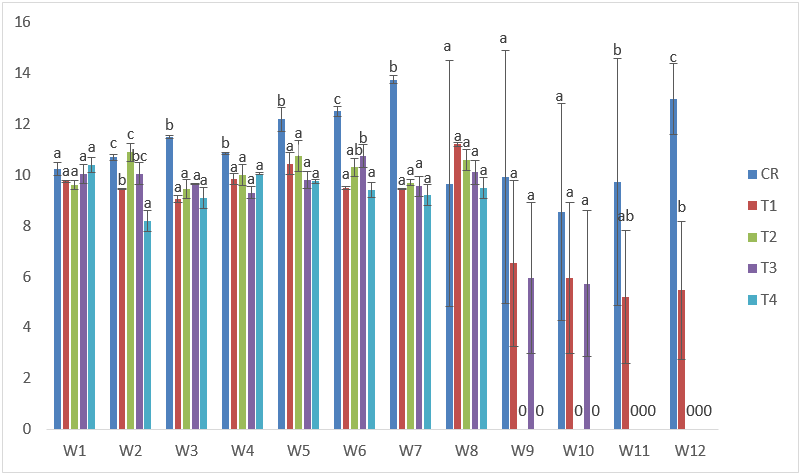
Figure 5: Mean values of total lengths of C. gariepinus exposed to sub-lethal concentrations of Cd for a period of 12 weeks.
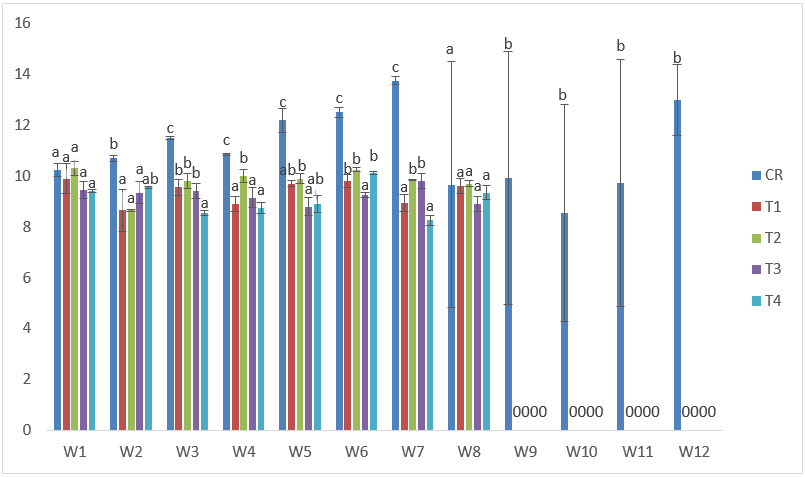
Figure 6: Mean values of total lengths of C. gariepinus exposed to sub-lethal concentrations of Cd supplemented with vitamin A for a period of 12 weeks.
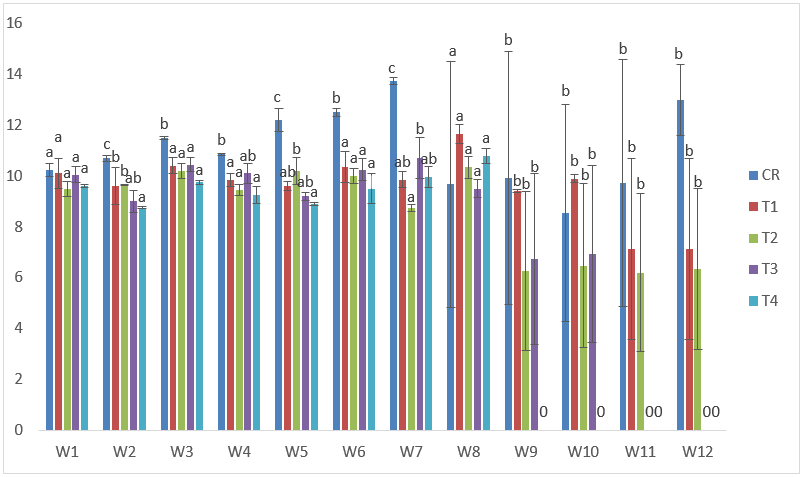
Figure 7: Mean values of total lengths of C. gariepinus exposed to sub-lethal concentrations of Cd supplemented with vitamin C for a period of 12 weeks.
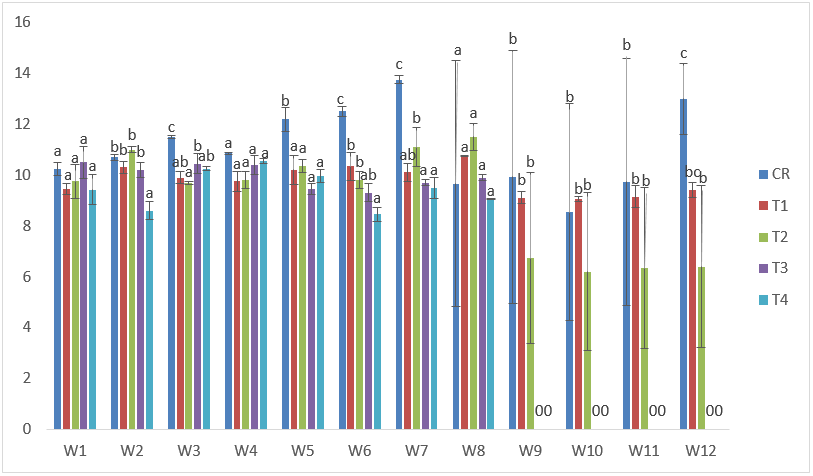
Figure 8: Mean values of total lengths of C. gariepinus exposed to sub-lethal concentrations of Cd supplemented with vitamin E for a period of 12 weeks.
Weight parameters of C. gariepinus exposed to sub-lethal concentrations of Cd toxicant and their respective supplemented treatments with Vitamins A, C and E
On the other hand, samples exposed to Cd treatments had the highest weight of 13.81g in T1 at the 5th week of exposure; while the lowest weight gain was 3.61g in T1 at the 12th week after exposure. Also, at this point (12th week) the samples appeared emaciated, and lethargic in swimming because majority displayed loss of appetite as from the 8th week of exposure. There was also general decline in weight especially at the later stages. The highest SGR in this group was obtained in T2. (Table 1 and Figure 9).
On the other hand, samples exposed to Cd treatments had the highest weight of 13.81g in T1 at the 5th week of exposure; while the lowest weight gain was 3.61g in T1 at the 12th week after exposure. Also, at this point (12th week) the samples appeared emaciated, and lethargic in swimming because majority displayed loss of appetite as from the 8th week of exposure. There was also general decline in weight especially at the later stages. The highest SGR in this group was obtained in T2. (Table 1 and Figure 9).
The highest weight obtained in samples exposed to CdVA treatments was 9.54g in T2 at the 3rd week of exposure; while the lowest was obtained in T3 at the 8th week of exposure with 3.27g. There was also general decline in weight when compared to the control. There were also negative %WG and low values of SGR in all the treatments. (Table 2 and Figure 10).
The results of the samples exposed to CdVC treatments indicated that the highest weight was recorded in T3 at the 7th week with 13.13g, while the lowest was recorded at the 8th week in T3 with 3.89g. Likewise, low values of %WG and SGR with the exception of T4 were obtained. (Table 3 and Figure 11).
The maximum weight obtained in samples exposed to CdVE treatments was 15.43g in T2 at the 7th week of exposure; while the lowest weight of 3.65g was recorded in T4 at the 6th week of exposure. Negative %WG and low values of SGR were also recorded. (Table 4 and Figure 12).
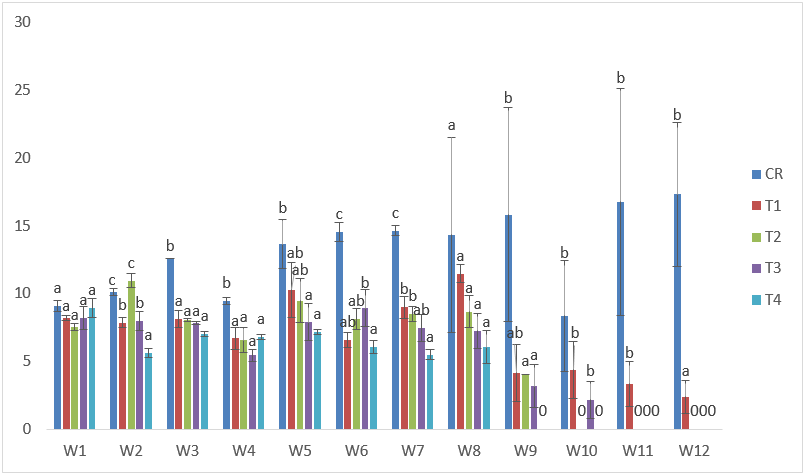
Figure 9: Mean values of weight of C. gariepinus exposed to sub-lethal concentrations of Cd for a period of 12 weeks.
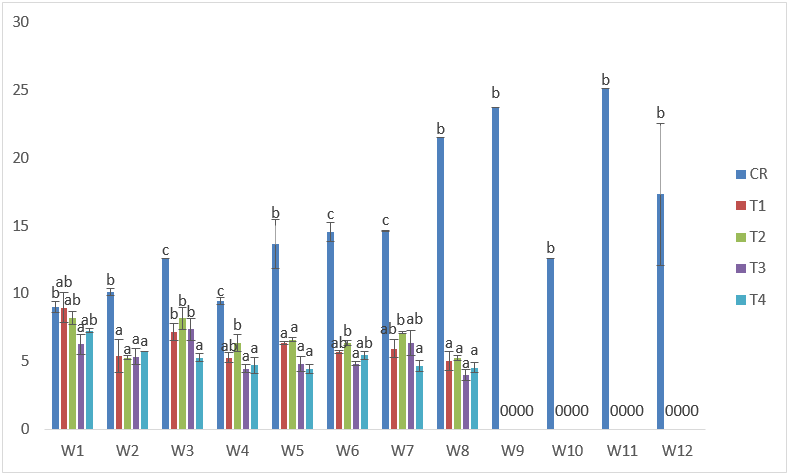
Figure 10: Mean values of weight of C. gariepinus exposed to sub-lethal concentrations of Cd supplemented with vitamin A for a period of 12 weeks.
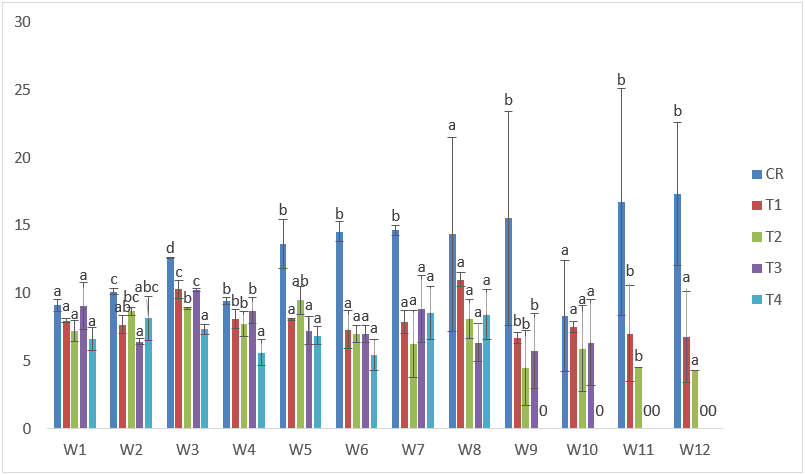
Figure 11: Mean values of weight of C. gariepinus exposed to sub-lethal concentrations of Cd supplemented with vitamin C for a period of 12 weeks.
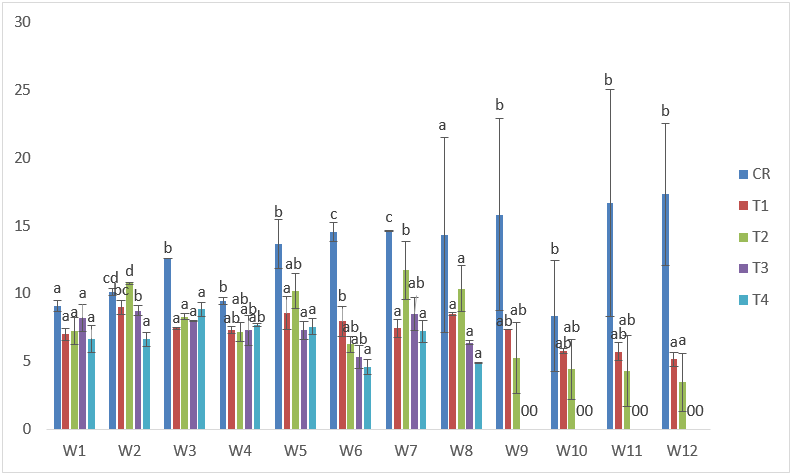
Figure 12: Mean values of weight of C. gariepinus exposed to sub-lethal concentrations of Cd supplemented with vitamin E for a period of 12 weeks.
| Treatments | Final Weight | Initial Weight | Weight gain | %Weight gain | Specific Growth Rate |
| C | 17.33 | 9.10 | 8.23 | 90 | 3.23 |
| T1 | 3.61 | 8.21 | -4.6 | -56 | 0.486 |
| T2 | 8.67 | 7.54 | 1.13 | 15 | 3.38 |
| T3 | 7.25 | 8.22 | -0.97 | -12 | 2.92 |
| T4 | 6.05 | 8.95 | -2.9 | -32 | 2.41 |
Table 1: Weight derivatives of samples of C. gariepinus exposed to sub-lethal concentrations of cadmium chloride for a period of 12 weeks.
| Treatments | Final Weight | Initial Weight | Weight gain | %Weight gain | Specific Growth Rate |
| C | 17.33 | 9.10 | 8.23 | 90 | 3.23 |
| T1 | 5.02 | 6.97 | -1.96 | -28 | 2.01 |
| T2 | 5.24 | 8.21 | -2.97 | -36 | 2.04 |
| T3 | 3.97 | 6.26 | -2.29 | -37 | 1.36 |
| T4 | 4.54 | 7.27 | -2.73 | -38 | 1.68 |
Table 2: Weight derivatives of samples of C. gariepinus exposed to sub-lethal concentrations of cadmium chloride supplemented with vitamin A for a period of 12 weeks.
| Treatments | Final Weight | Initial Weight | Weight gain | %Weight gain | Specific Growth Rate |
| C | 17.33 | 9.10 | 8.23 | 90 | 3.23 |
| T1 | 10.13 | 7.99 | 2.14 | 27 | 2.48 |
| T2 | 6.44 | 7.19 | -0.75 | -10 | 1.78 |
| T3 | 9.53 | 9.07 | 0.47 | 5 | 2.84 |
| T4 | 8.42 | 6.64 | 1.78 | 27 | 3.34 |
Table 3: Weight derivatives of samples of C. gariepinus exposed to sub-lethal concentrations of cadmium chloride supplemented with vitamin C for a period of 12 weeks.
| Treatments | Final Weight | Initial Weight | Weight gain | %Weight gain | Specific Growth Rate |
| C | 17.33 | 9.10 | 8.23 | 90 | 3.23 |
| T1 | 5.16 | 7.01 | -1.86 | -26 | 1.39 |
| T2 | 5.18 | 7.23 | -2.05 | -28 | 1.39 |
| T3 | 6.37 | 8.22 | -1.85 | -23 | 2.59 |
| T4 | 4.88 | 6.66 | -1.78 | -27 | 1.95 |
Table 4: Weight derivatives of samples of C. gariepinus exposed to sub-lethal concentrations of cadmium chloride supplemented with vitamin E for a period of 12 weeks.
Length-Weight Relatioships of Clarias gariepinus exposed to sub-lethal concentrations of Cd toxicant for a period of 12 weeks
The relationships between length and weight of C. gariepinus were linear throughout the period of exposure in all Cd treatment groups. T2 samples in all Cd treatment groups had the highest R2 values (0.6796) with the exception of CdVE treatments. (Figs. 4.25- 4.32).
The relationships between length and weight of C. gariepinus were linear throughout the period of exposure in all Cd treatment groups. T2 samples in all Cd treatment groups had the highest R2 values (0.6796) with the exception of CdVE treatments. (Figs. 4.25- 4.32).
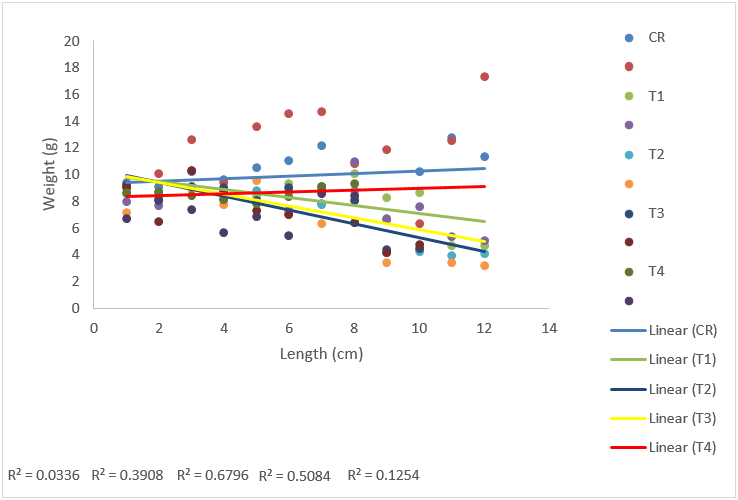
Figure 13: Length-Weight regression analysis of C. gariepinus exposed to sub-lethal concentration of cadmium for a period of 12 weeks.

Figure 14: Length-Weight regression analysis of C. gariepinus exposed to sub-lethal concentration of cadmium supplemented with vitamin A for a period of 12 weeks.

Figure 15: Length-Weight regression analysis of C. gariepinus exposed to sub-lethal concentration of cadmium supplemented with vitamin C for a period of 12 weeks.

Figure 16: Length-Weight regression analysis of C. gariepinus exposed to sub-lethal concentration of cadmium supplemented with vitamin E for a period of 12 weeks.
Discussions
Growth parameters of C. gariepinus exposed to sub-lethal concentrations of Cd toxicants and their respective supplemented treatments with Vitamins A, C and E
There were constant decreases in the standard lengths of samples exposed to CdVA with very slight improvement in samples exposed to CdVC and CdVE in comparison with the control. This probably brings to bear the deleterious nature of the toxicant such that tangible effects of the vitamins were not evident. The severity of the effects was manifested in higher concentrations of the toxicant such that there were mortalities especially at later stages of the exposure. Similar findings were reported by Rahman et al. (2018) where they found the highest length (27.92 ± 3.2 cm) in control samples where as in T-VI (the highest concentration with 3mg/L) the length gain was the lowest (16.14 ± 1.2 cm); and that the length gain was found to decrease gradually with increase in Cd concentration. Fish growth was also found to be higher in control compared to other treatments with Cd concentrations; and highest Cd accumulation was found in the liver as the major organ of detoxification (Rahman et al., 2018). Also, exposure of platichthys stellatus to varying concentrations of chromium led to decreased daily length gain, daily weight gain and condition factor after exposure to 400ppb for 2 weeks (Ko et al., 2019). In like manner, growth performance was significantly reduced with increasing Zn concentrations in comparison with the control which fared better; and the optimum feed intake and feed conversion ratio at day 56 were better in the control groups (Abdel-Tawwab et al., 2013). It was evident in this research that, unlike essential elements that are required in diet for optimal growth, functioning and sustenance of the internal environment (Isibor and Imoobe, 2017); the presence of Cd is entirely deleterious.
There were constant decreases in the standard lengths of samples exposed to CdVA with very slight improvement in samples exposed to CdVC and CdVE in comparison with the control. This probably brings to bear the deleterious nature of the toxicant such that tangible effects of the vitamins were not evident. The severity of the effects was manifested in higher concentrations of the toxicant such that there were mortalities especially at later stages of the exposure. Similar findings were reported by Rahman et al. (2018) where they found the highest length (27.92 ± 3.2 cm) in control samples where as in T-VI (the highest concentration with 3mg/L) the length gain was the lowest (16.14 ± 1.2 cm); and that the length gain was found to decrease gradually with increase in Cd concentration. Fish growth was also found to be higher in control compared to other treatments with Cd concentrations; and highest Cd accumulation was found in the liver as the major organ of detoxification (Rahman et al., 2018). Also, exposure of platichthys stellatus to varying concentrations of chromium led to decreased daily length gain, daily weight gain and condition factor after exposure to 400ppb for 2 weeks (Ko et al., 2019). In like manner, growth performance was significantly reduced with increasing Zn concentrations in comparison with the control which fared better; and the optimum feed intake and feed conversion ratio at day 56 were better in the control groups (Abdel-Tawwab et al., 2013). It was evident in this research that, unlike essential elements that are required in diet for optimal growth, functioning and sustenance of the internal environment (Isibor and Imoobe, 2017); the presence of Cd is entirely deleterious.
Improved growth trends were established in treatments with cadmium toxicant supplemented with vitamin E (higher than other treatment groups); with the maximum weight of 15.43g in T2 at the 7th week of exposure. Trace elements (especially cadmium) are naturally deleterious and are capable of eliciting myriads of physiological effects which are sometimes manifested physically. For instance, Witeska et al. (2014) studied the effects of Cd (100 μg/L) on the embryonic, larval or both stages of the ide (Leuciscus idus). Their results showed that metal toxication affected mortality, body size, various body morphometrics and deformities (vertebral curvatures and yolk sac deformities). And that the highest weight gain was found in control whereas the lowest weight gain was observed at the highest concentration of Cd. In like manner, there was reduced fish growth when Nile Tilapia was exposed to various concentrations of Cd (Rahman et al., 2018). In another development, Han et al. (2019) found that growth and hematological parameters measured decreased with increasing arsenic concentration, while the concentration of plasma components measured increased.Also, fish exposed to 10, 50 and 100µgHg/L showed a significant decrease in growth rates as from days 14 to 35 (Pratap, 2016). He attributed this to utilization of energy to overcome physiological stress induced by the toxicant, thus affecting fish growth. As the duration increases, there was lethargy and loss of appetite. This probably account in part the lack of weight gain in the later stages of the experiment as emaciation of the samples set in after utilizing the available energy to overcome stress. In line with this, Puvaneswari and Karuppasamy (2007) posited that exposure duration evidently affected sensitivity of fish larvae and influence the weight gain in Heteropneutes fossilis. This could also be due to the fact that,growth reduction under metal contamination increased the energy costs due to increased metabolism (Sherwood et al., 2000); and it is known that growth inhibition is a prominent effect of metal accumulation following chronic exposure (Zebral et al., 2018).
Conclusions and Recommendations
The exposure of C.gariepinus to the sub-lethal concentrations of CdCl2 elicited varying responses in the different treatment groups. The treatment groups that were supplemented with the vitamins displayed different levels of ameliorations of the effects of the toxicant especially in the lower concentrations at the end of the 12 weeks of exposure in terms of the standard and total lengths as well as the weight of the samples.
The samples exposed to CdVA exhibited slow growth through-out the exposure period. The CdVC treatments recorded slight general improvements in growth. The maximum weight was obtained in samples exposed to CdVE treatments.
The out-come of the research establishes the impacts of the vitamins in ameliorating the effects of the toxicant in the immediate environment of the fish. Therefore, the administration of the vitamins in appropriate concentrations (dose) in relation to the toxicant can improve upon the defensive mechanisms of fish (living things) against the onslaughts of the toxicant given that cadmium is very deleterious.
References
- Abdel-Tawwab, M., Mousaad, N. M. M., Sharafeldin, K. M. (2013). Changes in growth and biochemical status of common carp, Cyprinus carpio L. exposed to water-borne zinc toxicity for different periods. International Journal of Aquatic Research, 5(1), 11.
- Ahmed, N. F., Sadek, K. M., Soliman, M. K., Khalil, R. H., Khafaga, A. F., Ajarem, J. S., Maodaa, S. N., Allam, A. A. (2020). Moringa Oleifera Leaf Extract Repairs the Oxidative Misbalance following Sub-Chronic Exposure to Sodium Fluoride in Nile Tilapia Oreochromis niloticus. Animals,10, 626.
- Ahmad, Z. (2012). Toxicity bioassay and effects of sub-lethal exposure of malathion on biochemical composition and haematological parameters of Clarias gariepinus. African Journal of Biotechnology, 11(34), 8578 -8585.
- Athar, T., Waris, A. A. & Nisar, M. (2018). A review on toxicity and environmental implications of heavy metals. Emergent Life Sciences Research, 4(2),31-37.
- Ayyat, M. S., Ayyat, A. M., Naiel, M. A., Al-Sagheer, A. A. (2020). Reversal e?ects of some safe dietary supplements on lead contaminated diet induced impaired growth and associated parameters in Nile tilapia. Aquaculture, 515, 734580.
- Dahunsi, S. O., Oranusi, S. U., & Ishola, R. O. (2012). Bioaccumulation Pattern of Cadmium and Lead in the Head Capsule and Body Muscle of Clarias gariepinus (Burchell, 1822) Exposed to Paint Emulsion Effluent. Research Journal of Environmental and Earth Sciences, 4(2), 166-170.
- FAO (2003). Food Security: concepts and measurement. Rome: Food and Agriculture Organization of the United Nations. In FAO (Ed.), Trade Reforms and Food Security. pp. 25-34.
- Han, J., Park, H., Kim, J., Jeong, D., & Kang, J. (2019). Toxic Effects of arsenic on growth, hematological parameters, and plasma components of starry flounder, Platichthys stellatus, At two water temperature conditions. Fisheries and Aquatic Sciences, 22, 3.
- Isibor, P. O., & Imoobe, T. O. T. (2017). Trace Metals in Water, Bottom Sediment, Shrimp and Dependent Human Blood in Ukwuani Local Government Area of Delta State, Nigeria. Asian Journal of Environment and Ecology, 2(3), 1–16.
- Ko, H., Park, H., & Kang, J. (2019). Change of growth performance, haematological parameters and plasma component by hexavalent chromium exposure in starry flounder, Platichthys stellatus. Fisheries and Aquatic Sciences, 22, 9.
- Merciai, R., Guasch, H., Kumar, A., & Sabater, S. (2014). Trace metal concentration and ?sh size: variation among ?sh species in a Mediterranean river. Ecotoxicology and Environmental Safety, 107, 154–163.
- Osfor, M. M. H., Ibrahim, H. S., Mohamed, Y. A., Ahmed, A. M., Abd El Azeem, A. S., & Hegazy, A. M. (2010). Effect of alpha lipoic acid and vitamin E on heavy metals intoxication in male albino rats. Journal of Animal Science, 6, 56–63.
- Pratap, H. B. (2016). Haematological Responses and Growth of African fresh water cichlids, Oreochromis niloticus exposed to ambient inorganic mercury. International Journal of Zoological Investigations, 2(1), 9-16.
- Puvaneswari, S., & Karuppasamy, R. (2007). Accumulation of cadmium and its effects on the survival and growth of larvae of Heteropneustes fossilis (Bolch, 1974). Journal of Fish and Aquatic Sciences, 2(1), 27-37.
- Rahman, Z., Ahmad, I., & Rashid, I. (2018). Effects of Cadmium Exposure on Growth and Survival and Accumulation in Various Organs of Nile Tilapia (Oreochromis niloticus, Linnaeus). Journal of Agriculture and Aquaculture, 1(1).
- Sherwood, G. D., Rasmussen, J. B., Rowan, D. J., Brodeur, J., & Hontela, A. (2000). Bioenergetic cost of heavy metal exposure in yellow perch (Perca flavescens): insitu estimates with a radiotracer (137Cs) technique. Canadian Journal of Fisheries and Aquatic Sciences, 57(2), 441-450.
- Shilpi, G., Shilpi, S., & Sunita, S. (2015). Tolerance Against Heavy Metal Toxicity In Cyanobacteria: Role Of Antioxidant Defense System. International Journal of Pharmacy and Pharmaceutical Sciences, (7) (2), 0975-1491.
- Witeska, M., Sarnowski, P., ?ugowska, K., & Kowal, E. (2014). The effects of cadmium and copper on embryonic and larval development of ide, Leuciscus idus L. Fish Physiology and Biochemistry, 40, 151-163.
- Zebral, Y. D., Anni, I. S. A., Afonso, S. B., Abril, S. I. M., Klein, R. D., & Bianchini, A. (2018). Effects of life-time exposure to waterborne copper on the somatotropic axis of the viviparous fish, Poecilia vivipara. Chemosphere, 203, 410-417.
Citation: Samuel PO, Arimoro FO, Ayanwale AV and Mohammad HL. (2021). Assessment of the Ameliorative Roles of Vitamins A, C and E on Morphometric Parameters of Clarias Gariepinus (Burchell, 1822) Fingerlings Exposed to Cadmium Choride”. Journal of Agriculture and Aquaculture 3(1). DOI: 10.5281/zenodo.4575180
Copyright: © 2021 Samuel PO. This is an open-access article distributed under the terms of the Creative Commons Attribution License, which permits unrestricted use, distribution, and reproduction in any medium, provided the original author and source are credited.
