Research Article
Volume 2 Issue 3 - 2020
Using Candlestick Charting Techniques to Investigate Glucose Behaviors (GH-Method: Math-Physical Medicine)
EclaireMD Foundation, USA
*Corresponding Author: Gerald C. Hsu, EclaireMD Foundation, USA.
Received: June 22, 2020; Published: July 15, 2020
Introduction
This paper describes investigation results of glucose behaviors based on both finger and sensor data using candlestick charting techniques.
Method
A Japanese merchant, who traded in the rice market in Osaka, Japan, started the candlestick charting around 1850. An American, Steve Nison brought the candlestick patterns to the Western world in 1991. These techniques are largely used in today’s stock market to predict the price direction or action.
On 4/17/2018, the author had an idea to study glucose behavior by using the candlestick chart (aka “K-Line”) and subsequently developed a customized software to analyze his big glucose data. The analogies between fluctuations of stock price and glucose value are as follows:
- Stock prices are closely related to the psychology of the buyer/seller, which is similar to the glucoses related to a patient’s behavior psychology.
- When there are more buyers than sellers, the price goes up, which is similar to the glucose value rising when carbs/sugar intake (buyer) increases.
- When there are more sellers than buyers, price goes down, which is similar to the glucose value decreasing when exercise (seller) increases.
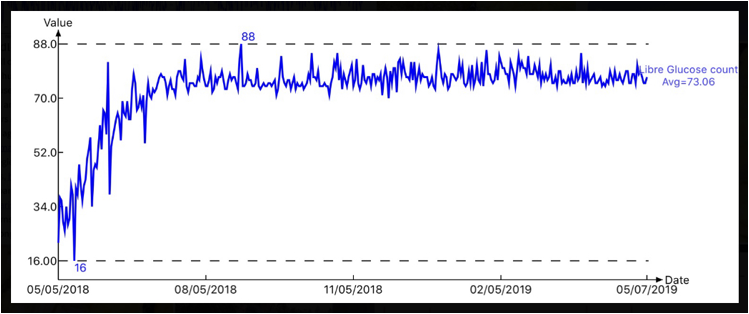
During the period of 5/5/2018 through 5/7/2019, the author collected 26,886 glucose data via a sensor placed on his upper left arm (Figure 1: 73.06 measurements/day). He defined (OHLC) open value as his recorded glucose at 7:00, closed value at 23:30, lowest glucose within a day as the minimum value, highest as the maximum value, and average glucose as the daily average value of ~73 recorded data. Based on these 368 candlestick bars, glucose patterns and moving trends can be observed and analyzed through further mathematical and statistical operations. Finally, he interpreted these operational results with his acquired knowledge of biomedical phenomena in order to discover some hidden medical truth and potential health dangers.
Since the stock market is much more lucrative than the medical research field, it attracts more talented mathematicians and engineers to work in the financial industry. As a result, the author decided to import the candlestick techniques and apply them to his medical research activities in order to learn and gain from other intellectuals’ knowledge and experiences.
Results
Here are some of his research findings:
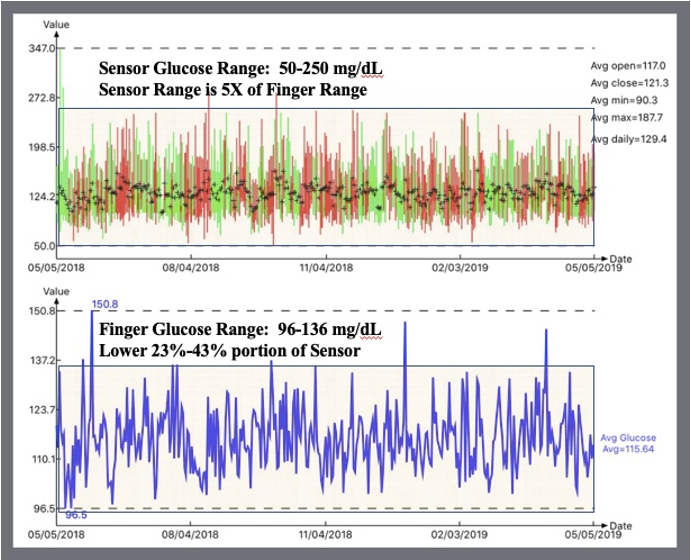
- The sensor-monitor data fluctuate between a band of 50 to 250 mg/dL, while the finger-piercing data fluctuate between a band of 96 to 136 mg/dL. The finger data covers a mere 20% range of sensor area (Figure 2: bottom portion of 23% to 43%). This means that the existing finger-piercing glucose testing results cover only the lower half of the sensor collected data range which will miss many of the glucose spikes.
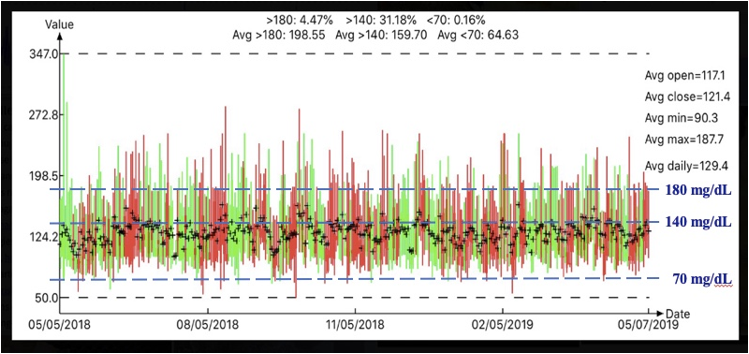
- By using segmentation pattern analysis (Figure 3 & 4), further calculations have revealed that on the high glucose segment, 31.2% of the total glucose data are above 140 mg/dL (with an average glucose of 160 mg/dL, equal to A1C>7.2%, diabetes) and 4.5% of the total glucose data are above 180 mg/dL (with an average glucose of 199 mg/dL, equal to A1C>8.5% severe T2D). These high glucose values are the source of diabetes induced complications such as heart attack, stroke, thyroid and kidney issues, eye and foot problems.
- On the low glucose segment, there are 0.2% of the total data below 70 mg/dL with an average glucose of 65 mg/dL. These low glucose values could cause life-threatening conditions from insulin shock. Fortunately, the author has been careful on controlling his low glucose conditions, especially during sleeping hours at night.
- Average FPG (average value between open and close values) is lower than the daytime’s average glucose (summation of 3 PPG periods and glucose data between meals).
- This paper presents partial analysis results based on a candlestick chart over 368 days period. Future detailed glucose analysis of candlestick bars within a day (i.e. “intraday” analysis) would reveal more information regarding the glucose moving trend and detailed patterns within a day.

Figure 2: Finger-piercing glucose data are located at lower half of Sensor-based glucose data range.
Conclusion
This paper has further demonstrated the power of observation of the glucose phenomena, derivation of mathematical equations, application of various computational tools, and finally combined with biomedical interpretations to discover and predict more biomedical findings regarding the human body.
References
- Hsu, Gerald C. (2018). Using Math-Physical Medicine to Control T2D via Metabolism Monitoring and Glucose Predictions. Journal of Endocrinology and Diabetes, 1(1): 1-6.
- Hsu, Gerald C. (2018). Using Signal Processing Techniques to Predict PPG for T2D. International Journal of Diabetes & Metabolic Disorders, 3(2): 1-3.
- Hsu, Gerald C. (2018). Using Math-Physical Medicine and Artificial Intelligence Technology to Manage Lifestyle and Control Metabolic Conditions of T2D. International Journal of Diabetes & Its Complications, 2(3): 1-7.
- Hsu, Gerald C. (2018, June). Using Math-Physical Medicine to Analyze Metabolism and Improve Health Conditions. Video presented at the meeting of the 3rd International Conference on Endocrinology and Metabolic Syndrome 2018, Amsterdam, Netherlands.
- Hsu, Gerald C. (2018). Using Math-Physical Medicine to Study the Risk Probability of having a Heart Attack or Stroke Based on Three Approaches, Medical Conditions, Lifestyle Management Details, and Metabolic Index. EC Cardiology, 5(12): 1-9.
Citation: Gerald C. Hsu. (2020). Using Candlestick Charting Techniques to Investigate Glucose Behaviors (GH-Method: Math-Physical Medicine). Journal of Biotechnology and Immunology 2(3).
Copyright: © 2020 Gerald C. Hsu. This is an open-access article distributed under the terms of the Creative Commons Attribution License, which permits unrestricted use, distribution, and reproduction in any medium, provided the original author and source are credited.


