Research Article
Volume 2 Issue 3 - 2020
Linkage among metabolism, immune system, and various diseases using GH-Method: math-physical medicine (MPM)
EclaireMD Foundation, USA
*Corresponding Author: Gerald C. Hsu, EclaireMD Foundation, USA.
Received: May 18, 2020; Published: June 06, 2020
Introduction
This research note discusses cases of death impacted by various diseases and different immune systems that are based on the body’s overall metabolic conditions. By reviewing the author’s past 10-year study of metabolism and certain branches of internal medicine, he is able to describe the causes of death, diseases, and immune system from a general macro-perspective, while focusing on metabolism from a detailed micro-perspective.
Method
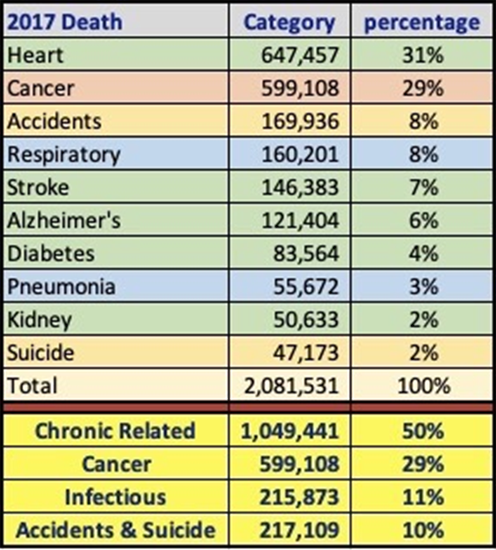
Figure 1 shows the mortality rate of the leading causes of death in the year 2017 (from US-CDC). Approximately 2.1 million people died from multiple conditions in the United States. Among them, the first group (almost 50% or 1.7 million deaths) is affected by various chronic diseases and their complications, which were directly or indirectly related to metabolic disorders, and most likely influenced by poor metabolic conditions. The second group (around 29%) is cancer induced by outgrown and mutated “bad” cells. The third group (about 11%) is infectious diseases resulting from external virus attack on body cells. The fourth group (around 10%) is accidental and suicidal death that has nothing to do with physiological diseases, though some suicidal cases are related to psychological disease. The first three groups have direct connection with one of the following three states of the body organ cells: (1) functional disorders; (2) outgrown or mutated cells killing normal and healthy cells; or (3) external virus attacks and then kills the organ cells.
There are numerous studies proving that by having a strong immune system can prevent the above three leading causes of death, i.e. chronic disease complications, cancer, and viral diseases. Furthermore, many research results have also shown the close connection between immunity and metabolism. Two papers cited that they are linked by proteins of dual function (references 1 & 2): the immune system defends against pathogens and maintains tissue homeostasis for the life of the organism. Collectively, these studies have revealed that the metabolic pathways of oxidative metabolism, glycolysis, and glutaminolysis preferentially fuel the cell fate decisions and effector functions of immune cells. (Reference 3).
All human beings are born with normal and abnormal cells, such as cancer cells. When the immune system gets weaker due to poor metabolic conditions, those bad cells can then grow, mutate, and transport quickly in the body to attack or kill a big portion of the normal cells. This will lead to major organ failure and eventually death.
In conclusion, having a good metabolism will reinforce our immune system to further reduce the probability of death caused by chronic disease complications, cancer, or infectious disease by virus attack.
In order to reduce the probability of death, the author feels he should go to the most fundamental level of health maintenance by understanding quantitatively and investigating how to exactly improve our body’s metabolism.
In 2014, he utilized concepts of topology from advanced mathematics and finite element method from advanced engineering to construct a mathematical model of the human metabolism. This system contains 10 categories and nearly 500 elements. Its four output categories contain body weight, glucose, blood pressure, and lipids. Its six input categories contain food, water intake, exercise, sleep, stress, and daily routines. Finally, by combining all of these 10 categories and 500 elements, he could define a system with a new term known as the “Metabolism Index (MI)” in order to indicate a person’s overall health state.
Furthermore, he programmed this metabolism system into an APP software on his iPhone. Therefore, not only could he conduct his daily data input, he will also be able to display his overall MI score and detailed metabolic performance instantly on his mobile unit. Since entering the 500 elements manually would be time consuming, he utilized the artificial intelligence technology to achieve its ease-of-use purpose while maintaining its high data accuracy. Thus far, he has collected about 2 million data related to his own body. This dataset has more than 1.5 million data related to his daily lifestyle details and the other 0.5 million data related to his medical conditions, especially chronic disease conditions.
Here are the metabolic sub-category for his established standards from medical, nutrition, and healthcare viewpoints:
M1 (weight): 170 lbs. (77.3 kg)
M2 (glucose): 120 mg/dL (6.7 mmol/L)
M3 (blood pressure: SBP/ DBP): 120/80
M4 (lipid: triglyceride/HDL/LDL/total cholesterols): 150/40/130/200
M5 (exercise): 10,000 walking steps
M6 (drinking water): 2,000 cc / day
M7 (sleep): 9 measuring elements with two most prominent elements, sleeping hours and wake up time during sleep
M8 (stress): 19 elements for “psychologically normal” people (only 11 active elements to be used by the author); 15 elements for people who have “personality disorders”
M9 (food & meal): 5 elements for food quantity, 20 elements for food quality
M10 (daily routine): 15 elements for chronic diseases, 7 elements for cancer’s environmental factors
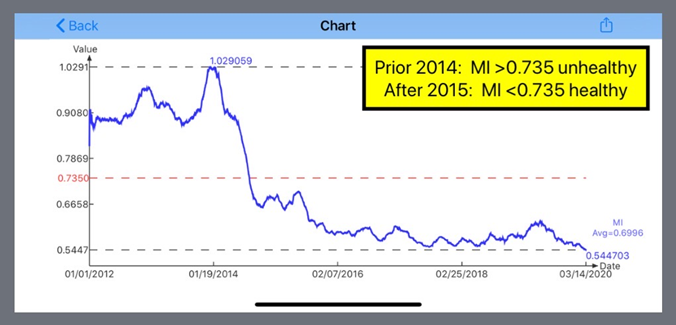
It should be noted that, due to data normalization, if a person gets a 0.735 score (or 73.5%) of the total MI, it indicates that this individual has reached his/her standard metabolic target. If MI is lower than 0.735, this means his/her metabolic condition is better than normal condition, and vice versa; if MI is higher than 0.735, this implies his/her condition is worse than the normal condition.
In the subsequent five years (2015 through 2019), the author has applied many different methods and tools he has learned in various disciplines, such as advanced mathematics, physics, psychology, engineering, and internal medicine to develop many analysis algorithms in order to investigate various disease groups mentioned in this paper.
Results
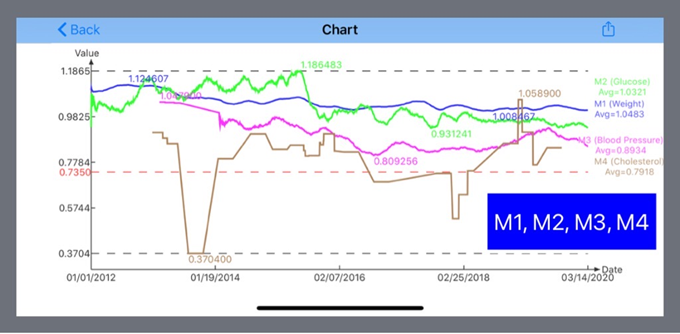
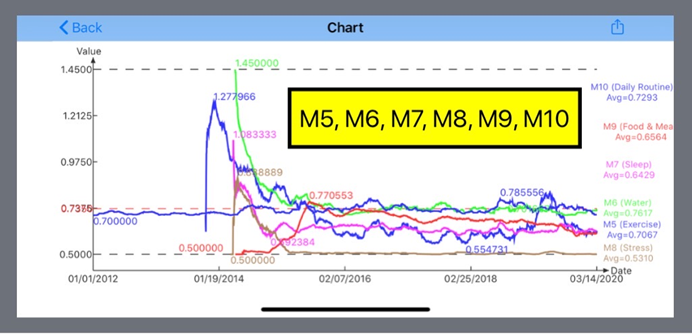
Figures 2 and 3 summarized the moving trend curves (i.e. 90-days moving averages) and overall average values for M1 through M10 during past eight years (1/1/2012 through? 3/14/2020). These diagrams indicate his efforts and outcomes of his metabolic improvements and disease control.
The following data are average results for a time period of 6 to 8 years in each metabolic sub-category:
M1 (weight): 176.7 lbs. (decreased from 198 lbs.)
M2 (glucose): 124 mg/dL (decreased from 280 mg/dL)
M3 (blood pressure: SBP/ DBP): 111/68 (decreased from 139/96)
M4 (lipid: triglyceride/HDL/LDL/total cholesterols): 125/39/96/144
M5 (exercise): 15,800 walking steps (increased from ~5,000 steps / day)
M6 (drinking water): 2,837 cc / day (increased from ~500 cc / day)
M7 (sleep): 83% satisfaction level; with 7 hours of sleep time and 1.5 wake up times per night
M8 (stress): 95% satisfaction level, almost lived a “stress-free” life
M9 (food & meal): 68% satisfaction level; with a daily food portion at 84% of previous food intake per meal and 95% satisfaction level of food and meal quality standard
M10 (daily routine): 96% satisfaction level; have a very stabilized and regular daily normal routine life pattern.
As shown in Figure 4, the author’s overall MI score has decreased from 102% prior 2014 to below 60% after 2015. This sharp decline of MI score during 2014 and 2015 and hereafter was due to his quantitative understanding of mathematical metabolism model and his persistent efforts on improving his overall metabolic conditions and chronic diseases.
The above scores revealed that his scientific lifestyle management method and continuous metabolic improvement for the past eight years. His medical examination records for the past 10 years have also shown that he has gradually improved and eventually controlled his many severe medical conditions, such as obesity, diabetes, hypertension, hyperlipidemia, cardiovascular diseases, nephrological and urological conditions, peripheral nervous system, foot ulcer, and diabetic retinopathy. He also believes that his efforts on metabolic improvement should strengthen his overall immunity to protect himself against threats from both cancer and virus attack.
Conclusions
The author has demonstrated his detailed mathematical metabolism model and his efforts on managing and improving his overall metabolic conditions. Through his research and implementation efforts, his immune system would also be strengthened; therefore, this increased immunity will also help his body against future attacks from cancer and infectious diseases.
References
- Schaffer, Adreas and Buechler, Christa. (2012). CTRP family: linking immunity to metabolism. Trends in Endocrinology and Metabolism, April; 23(4): 194-204.
- Pavlov, Valentin A. and Tracey, Kevin J. (2012). The vagus nerve and the inflammatory reflex—linking immunity and metabolism. Nature Reviews Endocrinology, Dec; 8(12): 743-754.
- Ganeshan Kirthana and Chawla, Ajay. (2014). Metabolic regulation of immune responses. Annual Review of Immunology, 32: 609-634.
- Hsu, Gerald C. (2018). Using Math-Physical Medicine to Control T2D via Metabolism Monitoring and Glucose Predictions. Journal of Endocrinology and Diabetes, 1(1): 1-6.
- Hsu, Gerald C. (2018). Using Signal Processing Techniques to Predict PPG for T2D. International Journal of Diabetes & Metabolic Disorders, 3(2): 1-3.
- Hsu, Gerald C. (2018). Using Math-Physical Medicine and Artificial Intelligence Technology to Manage Lifestyle and Control Metabolic Conditions of T2D. International Journal of Diabetes & Its Complications, 2(3): 1-7.
- Hsu, Gerald C. (2018). Using Math-Physical Medicine to Study the Risk Probability of having a Heart Attack or Stroke Based on Three Approaches, Medical Conditions, Lifestyle Management Details, and Metabolic Index. EC Cardiology, 5(12): 1-9.
Citation: Gerald C. Hsu. (2020). Linkage among metabolism, immune system, and various diseases using GH-Method: math-physical medicine (MPM). Journal of Biotechnology and Immunology 2(3).
Copyright: © 2020 Gerald C. Hsu. This is an open-access article distributed under the terms of the Creative Commons Attribution License, which permits unrestricted use, distribution, and reproduction in any medium, provided the original author and source are credited.


