Research Article
Volume 2 Issue 2 - 2020
Analyzing a Simple Lunch’s Predicted Postprandial Plasma Glucose Results Using GH-Method: Math-Physical Medicine
EclaireMD Foundation, USA
*Corresponding Author: Gerald C. Hsu, EclaireMD Foundation, USA.
Received: May 05, 2020; Published: May 20, 2020
Introduction
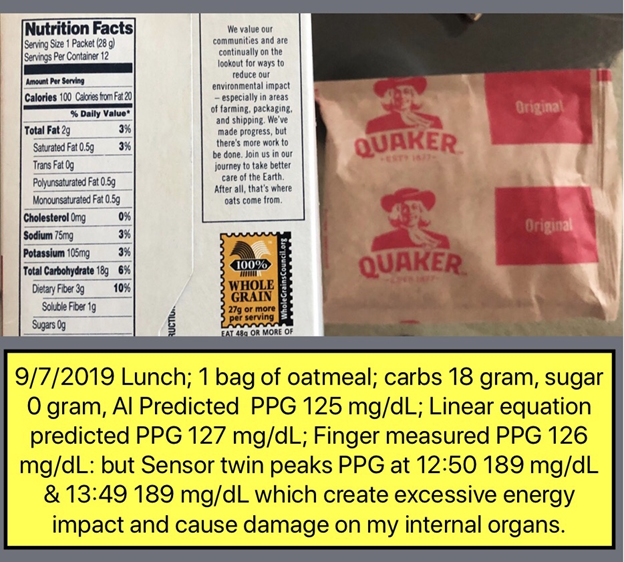
This paper discusses both predicted and measured postprandial plasma glucose (PPG) results from a simple lunch of one small bag of Quaker oatmeal: 18 grams carbs and 0 grams of sugar using the GH-Method: math-physical medicine.
This article is written to aim at training dietitians, nurses, and other diabetes healthcare professionals.
Methods
The author applied signal processing of wave theory from earth physics and exploration along with electronics and communication engineering to decompose generalized PPG wave into 19 influential factors. This sophisticated analysis method has achieved a prediction accuracy of >99.6% (based on ~5,200 meal data from the author). He applied optical physics and artificial intelligence (AI) to develop a Glucometer software which includes only eight contribution factors, but also utilizes approximately eight million food nutritional data stored on a cloud server. This AI method’s prediction accuracy has achieved ~98% (based on a 3 to 12-month meal data of seven patients). Finally, in order to teach and train food nutritionists and dietitians in an easier way, he further simplified this nonlinear system and complex AI model into two-parameters based (food and exercise) linear equation to predict PPG. This linear equation model’s prediction accuracy has achieved ~95% (based on the same 3 to 12-month meal data of seven patients).
It is necessary to describe this two-parameters linear equation again (Reference no. 97):
Predicted PPG
= ((Baseline Glucose A)
+ (Carbs/Sugar grams * Variable B) - (Walking Steps * Variable C)) * Variable D
= ((Baseline Glucose A)
+ (Carbs/Sugar grams * Variable B) - (Walking Steps * Variable C)) * Variable D
Results
The author’s lunch on 09/07/2019 was a simple meal which contained a small bag of Quaker oatmeal: 18 grams of carbs and 0 gram of sugar (Figure 1). He measured his PPG on the middle finger of his left hand, two hours after his first bite of lunch which resulted in a reading of 126 mg/dL. His AI Glucometer software predicted PPG was 125 mg/dL and his two-parameters linear equation predicted PPG was 127 mg/dL. Both prediction models have achieved the same 99.2% prediction accuracy for this particular meal.
At the same time, his seven major data for a total of 12 sensor collected PPG values (applied on his left arm) are listed below (see Figure 2):
| Time (minutes) | PPG (mg/dL) |
| 0 | 173 |
| 15 | 167 |
| 50 | 189 |
| 72 | 144 |
| 109 | 189 |
| 121 | 150 |
| 180 | 141 |
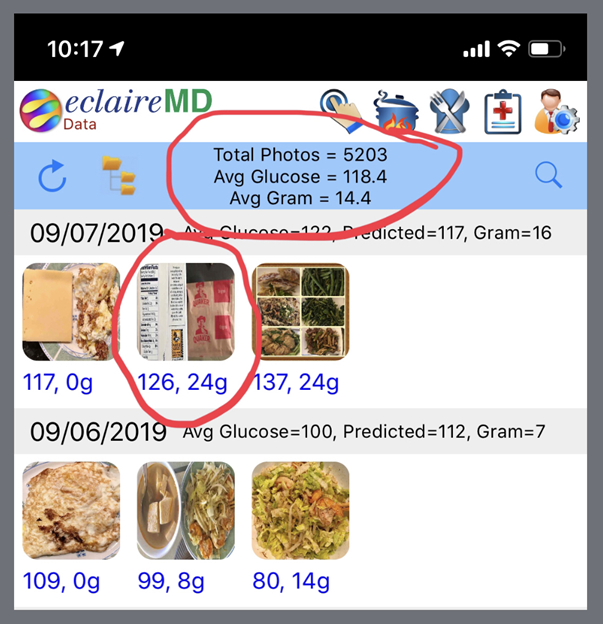
This particular PPG waveform (i.e. curve) depicts a typical “twin peaks” pattern due to his carb intake of 25% higher than his average carbs intake at 14.4 grams per meal (Figure 3) despite his post-meal walk of 6,000 steps. It should be noted that these twin peaks of 189 mg/dL are associated with high left-over energy which circulates within the blood vessels throughout the body and damaged his internal organs.

Figure 3: Author’s meal record - a total of 5203 meal photos and their average carbs/sugar 14.4 grams, average PPG 118.4 mg/dL.
The author’s baseline condition (see Reference No. 112, i.e. his pancreatic beta cell health state) is 121. His carb intake would give him an increased glucose around 36-45 mg/dL and his 6,000 walking steps would give him a decreased glucose of approximately 30-45 mg/dL. These two bands of glucose ranges are due to consideration of T2D severity in a particular patient. In this case, the linear equation operation is as follows:
Predicted PPG
= 121+ 36 - 30
= 127 mg/dL
= 121+ 36 - 30
= 127 mg/dL
Conclusion
Although this article only describes a single meal’s glucose situation, it is still useful through this example to explain the author’s GH-Method: math-physical medicine (MPM) approach and its application on PPG prediction. There is no need to teach healthcare professionals this MPM approach in detail since it involves different background materials which takes years of learning. Once they can master the application of certain prediction techniques, they can help T2D patients to control their diabetes conditions effectively.
References
- Hsu, Gerald C. (2018). Using Math-Physical Medicine to Control T2D via Metabolism Monitoring and Glucose Predictions. Journal of Endocrinology and Diabetes, 1(1): 1-6.
- Hsu, Gerald C. (2018, June). Using Math-Physical Medicine to Analyze Metabolism and Improve Health Conditions. Video presented at the meeting of the 3rd International Conference on Endocrinology and Metabolic Syndrome 2018, Amsterdam, Netherlands.
- Hsu, Gerald C. (2018). Using Signal Processing Techniques to Predict PPG for T2D. International Journal of Diabetes & Metabolic Disorders, 3(2): 1-3.
- Hsu, Gerald C. (2018). Using Math-Physical Medicine and Artificial Intelligence Technology to Manage Lifestyle and Control Metabolic Conditions of T2D. International Journal of Diabetes & Its Complications, 2(3): 1-7.
- Hsu, Gerald C. (2018). A Clinic Case of Using Math-Physical Medicine to Study the Probability of Having a Heart Attack or Stroke Based on Combination of Metabolic Conditions, Lifestyle, and Metabolism Index. Journal of Clinical Review & Case Reports, 3(5): 1-2.
Citation: Gerald C. Hsu. (2020). Analyzing a Simple Lunch’s Predicted Postprandial Plasma Glucose Results Using GH-Method: Math- Physical Medicine. Archives of Nutrition and Public Health 2(2).
Copyright: © 2020 Gerald C. Hsu. This is an open-access article distributed under the terms of the Creative Commons Attribution License, which permits unrestricted use, distribution, and reproduction in any medium, provided the original author and source are credited.


