Research Article
Volume 4 Issue 1 - 2022
A New Mathematical Model for the Study of Soil Microbiology and Biology Activities
Assistant professor Semnan university-Iran
*Corresponding Author: Hamid kheyrodin, Assistant Professor, Semnan University - Iran.
Received: September 14, 2022; Published: December 22, 2022
Abstract
Biological activity in your soil helps to add organic matter, cycle nutrients, and create biodiversity. A biologically active soil supports natural soil food webs and the interactions that support a resilient and healthy soil. For increased soil biology, provide food, optimal conditions, and minimal disturbance. il biological activity influences soil structure and is encouraged by practices such as crop rotation or the establishment of cover crops which limit erosion during winter. In terms of agroecology, conservation practices are based on reduced-tillage or no-tillage and help to maintain, and/or to promote this biological fertility with the perspective of a sustainable management of organic matter.
Carbon-to-nitrogen ratio too is biological activity in soil, carbon-to-nitrogen ratio (C:N) of organic matter can vary from about 4:1 (low carbon, high nitrogen) for bacteria to more than 200:1 to 600:1 for woody materials. Ratio for wheat straw are about 80:1, and youn legumes may be 15:1. The C:N ratio of soil organic matter in agricultural soils averages 10:1. Fungi have a fairly constant C content of 45%, but N levels vary, resulting in C:N ratios of 15:1 to 4.5:1. s g ls e rt the r al Low N materials have a low nutritional quality for microbes. When organic materia are added to soil, the carbon triggers microbial growth. If the amount of N in the added material is inadequate to suppo increased growth, the microbes will absorb nitrogen from the soil and immobilize it in their tissues, thus depriving plants of nitrogen, at least temporarily. As a rule-of thumb, materials with C:N ratios less than 25 or 30:1 will not trigger this N deficiency in plants. Materials with lower C:N ratios tend to decompose quickly. Materials with highe C:N ratios are slow to decompose and can lead to carbon storage or sequestration in the soil when accompanied by addition nitrogen inputs in reduced tillage systems. C:N ratios of soil organic matter provide clues about the microbial community. For example, higher ratios tend to support more fungi compared to bacteria. A labile pool of soil organic matter with a low C:N ratio implies that the SOM consists of a high proportion of microbes.
Keywords: Soil; Activity; Mathematical model; C:N
Introduction
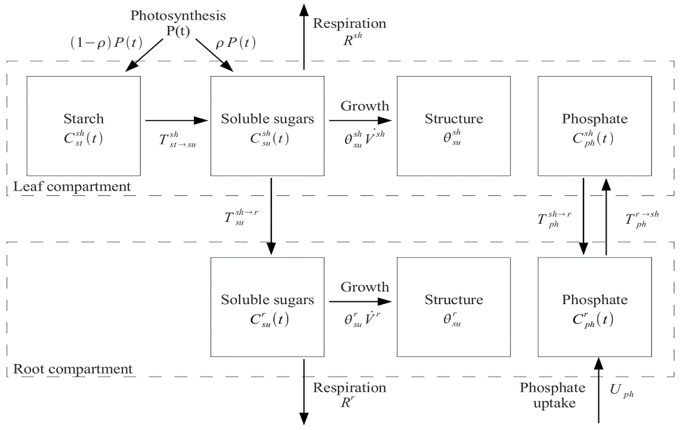
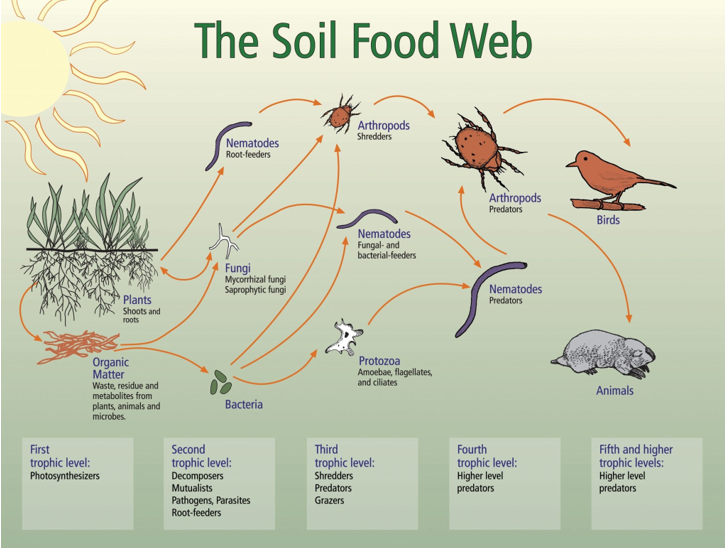
The increasing incidence of foodborne illnesses caused by (biofilm-producing) bacteria has promoted research aimed at finding new ways to combat foodborne pathogenic bacteria. Within the field of organic foods, this is an especially interesting quest, as the regulations involved prohibit the use of antibiotics for either growth promoting and/or therapeutic uses. Moreover, due to consumer demand and the increasing popularity of more natural/organic foods, new methods of microbial combat have to be found that can be used within the large-scale production of food animals, while avoiding the consequences of antibiotic resistance, gut microbiota disturbances, and residual effects on human health, as well as being environmental friendly and sustainable ways of resource usage. This index may be a part of an SQI in the future to assess the soil quality for sustaining agricultural productivity (figures 1, 2).
Biological ageing involves complex interactions of accumulating organ, cellular, and DNA damage leading to functional decline and increased risk of death. Biological functions including the age of reproductive maturity, reproductive frequency and can be better understood in the context of age. Estimates of chronological age are therefore useful for understanding these key ecological characteristics of wild animals. However, chronological age is difficult to estimate in individuals of most animal species (Nussey et al., 2013). Many species lack measurable external features that change with age. Therefore, new methods that allow estimation of chronological age will enhance our understanding of ageing and population biology in wild animals.
Soil enzymes are essential for soil health and played a key role in decomposing organic matter, energy availability, and NH4 to plants. Biochar is reported to have positive impact on soil enzyme composition, and addition of biochar with modifications in mangrove sediments increased the level of different enzymes such as B-glucosidase, phenol oxidase, and reducing the levels of acid phosphate and peroxidase enzymes. Biochar derived from Eichornia caused the increase in soil enzyme actions such as alkaline phosphatase (22.8%), acid phosphatase (32%), and fluorescein hydrolase (50%) in soil. The effect of biochar on enzyme activities depends on different factors such as soil type, biochar modifications, and the availability of biochar to soil enzymes.
Materials and Methods
Samples were collected from the upper 15 cm of the surface soil of each plot during the fallow period, when the crop was not raised (January 2018). In each plot, 10 sub-sample soil cores were collected randomly and pooled together in a composite sample, giving three biological replicates. Likewise, sampling was repeated three times, giving a total of nine replicates from four plots in each location. The debris, plant residues, and stones were removed during sampling to avoid any influence on the soil parameters analysed. The soil samples were packed in plastic bags, transported to the laboratory using an ice cooler box, and stored at 4°C. The gravimetric moisture content of the soil was measured immediately.
The natural acidity in soil found in many regions can prevent optimal performance on farms. To meet this challenge and achieve acceptable yields, farmers may sometimes need to use excessive quantities of NPK fertilizers. Soil acidification then gradually increases, with a negative impact on agriculture
Soil biological Properties
Soil organic carbon (SOC) was analysed by the wet chromic acid digestion method (Walkley and Black, 1934) and expressed as mg g−1 of soil. The microbial biomass carbon (MBC) was measured by the fumigation–incubation technique (Jenkinson and Powlson, 1976) and expressed as µg g−1 of soil. Soil labile carbon (SLC) was measured by the permanganate method (Blair and Crocker, 2000) and expressed as µg g−1 of soil. Soil protein was extracted from soil using a protocol as described by Hurisso et al. (2018) and expressed as µg g−1 of soil. The dehydrogenase (DHA) was measured by the procedure described by Casida Jr et al. (1964) and expressed as µg of triphenyl formazan released per g?soil d−1. The substrate-induced respiration (SIR) measured the rate of respiration in the soil after glucose was amended in it and expressed as µg of CO2-releasedg−1 soilh−1 (Enwall et al., 2007).
Soil organic carbon (SOC) was analysed by the wet chromic acid digestion method (Walkley and Black, 1934) and expressed as mg g−1 of soil. The microbial biomass carbon (MBC) was measured by the fumigation–incubation technique (Jenkinson and Powlson, 1976) and expressed as µg g−1 of soil. Soil labile carbon (SLC) was measured by the permanganate method (Blair and Crocker, 2000) and expressed as µg g−1 of soil. Soil protein was extracted from soil using a protocol as described by Hurisso et al. (2018) and expressed as µg g−1 of soil. The dehydrogenase (DHA) was measured by the procedure described by Casida Jr et al. (1964) and expressed as µg of triphenyl formazan released per g?soil d−1. The substrate-induced respiration (SIR) measured the rate of respiration in the soil after glucose was amended in it and expressed as µg of CO2-releasedg−1 soilh−1 (Enwall et al., 2007).
Data Analysis
The relation between soil variables influenced by long-term nutrient management adoptions was evaluated by Pearson correlation analysis (Pearson, 1895) and simple linear regression (Freedman, 2009) using SPSS (SPSS Statistics for Windows, Version 20.0. Armonk, NY: IBM Corp). The scoring function for each assessed variable of soil was developed by SPSS 20.0. For this, the data were transformed into rank scores (rank case function of SPSS) and scoring percentile was calculated using the following formula:
The relation between soil variables influenced by long-term nutrient management adoptions was evaluated by Pearson correlation analysis (Pearson, 1895) and simple linear regression (Freedman, 2009) using SPSS (SPSS Statistics for Windows, Version 20.0. Armonk, NY: IBM Corp). The scoring function for each assessed variable of soil was developed by SPSS 20.0. For this, the data were transformed into rank scores (rank case function of SPSS) and scoring percentile was calculated using the following formula:
To assess the relativeness of assessed soil variables and their cumulative contribution to the variability among the treatments, principal component analysis (PCA) (Wold et al., 1987) was performed on the data using XLSTAT
Estimating soil biological quality index
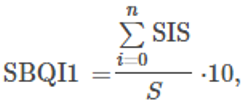
In the simple additive method, the assessed soil parameters were given threshold values based on the available literature and previous experiences. The threshold values of each parameter were further scored as soil index scores (SIS). From these score values, the SBQI, a unitless scoring value scaled to 1–10, was calculated using the formula as follows:
In the simple additive method, the assessed soil parameters were given threshold values based on the available literature and previous experiences. The threshold values of each parameter were further scored as soil index scores (SIS). From these score values, the SBQI, a unitless scoring value scaled to 1–10, was calculated using the formula as follows:
Where ΣSIS refers to the sum of all soil index scores and SISmin and SISmax are minimum and maximum values of SIS of the dataset. S represents the sum of maximum SIS (=24).
Weighed additive method (SBQI3)
For this, the data were transformed into rank scores (rank case function of SPSS) and the scoring percentile was calculated in SPSS. The scoring percentiles were summed and scaled to 10 (Moebius-Clune et al., 2016). Further, the index values were normalized using the minimum and maximum SBQI values of the dataset. The formula for the SBQI3 calculation is as follows:
For this, the data were transformed into rank scores (rank case function of SPSS) and the scoring percentile was calculated in SPSS. The scoring percentiles were summed and scaled to 10 (Moebius-Clune et al., 2016). Further, the index values were normalized using the minimum and maximum SBQI values of the dataset. The formula for the SBQI3 calculation is as follows:
Where ΣSBQI refers to the sum values from the above formula and SBQImin and SBQImax are minimum and maximum values of SBQI of the dataset.
PCA-based SBQI (SBQI4)
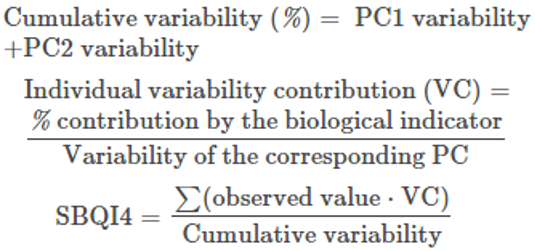
The principal component analysis of all six biological parameters of four soil samples of three locations was performed as described elsewhere. From the outcome of PCA, the SBQI was calculated (Andrews et al., 2002; Mandal et al., 2011; Masto et al., 2008). This SBQI used the percent contribution of individual variability to calculate the overall soil biological quality of the soil. The formulae adopted to calculate SBQI-4 are as follows.
The principal component analysis of all six biological parameters of four soil samples of three locations was performed as described elsewhere. From the outcome of PCA, the SBQI was calculated (Andrews et al., 2002; Mandal et al., 2011; Masto et al., 2008). This SBQI used the percent contribution of individual variability to calculate the overall soil biological quality of the soil. The formulae adopted to calculate SBQI-4 are as follows.
Quadrant-plot-based SBQI (SBQI5)
As any soil variable is not independently acting and depends on several other variables or is under the influence of other variables, the relativeness of two closely associated variables (examples SOC and MBC) is used to measure the soil biological quality. This method is adopted for the variables that are well correlated with each other. Six significantly correlated (P<0.001) variable pairs and their R2 values and means were used for the scoring (Table 3). The paired variables were plotted in a scatter plot using variable-1 (major contributor) on the x axis and variable-2 (secondary contributor) on the y axis. The scatter plot was converted into four quadrants by scaling the mean values of the corresponding variables on their axes. The right-handed upper quadrants representing “high” for both variables are scaled to 4 as both the variables above the means. The right-handed lower quadrant representing “high for variable-a and low for variable-b” is scaled to 3. Likewise, the left-handed upper quadrant is scored for 2, and the left-handed lower quadrant, which represents “low” for both the variables, had a value of 1. Since the major contributor is always on the x axis, high for variable-a and low for variable-b had a score value of 3 and its opposite had 2. All six pairs (SOC–MBC, SOC–SLC, SOC–SIR, MBC–SPI, MBC–DHA, MBC–SIR) were scored using this method and SBQI was calculated as follows:
As any soil variable is not independently acting and depends on several other variables or is under the influence of other variables, the relativeness of two closely associated variables (examples SOC and MBC) is used to measure the soil biological quality. This method is adopted for the variables that are well correlated with each other. Six significantly correlated (P<0.001) variable pairs and their R2 values and means were used for the scoring (Table 3). The paired variables were plotted in a scatter plot using variable-1 (major contributor) on the x axis and variable-2 (secondary contributor) on the y axis. The scatter plot was converted into four quadrants by scaling the mean values of the corresponding variables on their axes. The right-handed upper quadrants representing “high” for both variables are scaled to 4 as both the variables above the means. The right-handed lower quadrant representing “high for variable-a and low for variable-b” is scaled to 3. Likewise, the left-handed upper quadrant is scored for 2, and the left-handed lower quadrant, which represents “low” for both the variables, had a value of 1. Since the major contributor is always on the x axis, high for variable-a and low for variable-b had a score value of 3 and its opposite had 2. All six pairs (SOC–MBC, SOC–SLC, SOC–SIR, MBC–SPI, MBC–DHA, MBC–SIR) were scored using this method and SBQI was calculated as follows:
Validation of SBQIs in farmers' fields
To validate the SBQI methods developed from long-term manure experiment plots and also to check the consistency in SBQI calculations and to assess the relatedness among the SBQIs, the soil samples collected randomly from the farmers' field were assessed using the soil biological indicators as described in the previous chapter and the biological quality indices were calculated using the five methods as described earlier. The details of those soil samples were presented as Table 1 in the Supplement. All five SBQIs measured for long-term nutrient management adopted soils and farmers' soils were compared through Pearson correlation as described earlier to understand the effectiveness and relation of each other.
To validate the SBQI methods developed from long-term manure experiment plots and also to check the consistency in SBQI calculations and to assess the relatedness among the SBQIs, the soil samples collected randomly from the farmers' field were assessed using the soil biological indicators as described in the previous chapter and the biological quality indices were calculated using the five methods as described earlier. The details of those soil samples were presented as Table 1 in the Supplement. All five SBQIs measured for long-term nutrient management adopted soils and farmers' soils were compared through Pearson correlation as described earlier to understand the effectiveness and relation of each other.
Results
Statistical scrutiny of soil biological attributes
The histogram of measured values (x axis) of each variable and its frequency (y axis) with a distribution curve or bell curve showed that the data observed were normally distributed. The mean ± SD for the observed parameters, viz. 7.29 ± 2.46 (SOC), 382.51 ± 199.61 (MBC), 480.30 ± 234.17 (SLC), 5.46 ± 0.84 (SPI), 11.51 ± 9.54 (DHA), and 3.20 ± 0.56 (SIR), were well fitted in the curve. Among the six variables, the histograms of SOC and SLC were left-skewed; DHA. was bimodal, while those others were normal.
The histogram of measured values (x axis) of each variable and its frequency (y axis) with a distribution curve or bell curve showed that the data observed were normally distributed. The mean ± SD for the observed parameters, viz. 7.29 ± 2.46 (SOC), 382.51 ± 199.61 (MBC), 480.30 ± 234.17 (SLC), 5.46 ± 0.84 (SPI), 11.51 ± 9.54 (DHA), and 3.20 ± 0.56 (SIR), were well fitted in the curve. Among the six variables, the histograms of SOC and SLC were left-skewed; DHA. was bimodal, while those others were normal.
In correlation analysis, SOC had a significant correlation with the other five biological variables, while MBC, SLC, DHA, and SIR had a significant correlation with other variables except for SPI. Similarly, with SOC as an independent variable with others as the dependent variables, the linear regression coefficient (R2) showed significance (Table 5). All the dependent variables (MBC, SLC, SPI, DHA, SIR) showed significant R2 (P<0.001). However, SPI had the lowest R2 (0.237), while the SLC had the highest R2 (0.417). Likewise, SPI had the lowest but significant linear regression coefficient (0.089) with MBC, while others had high R2 values. SPI with other variables such as SLC, DHA, and SIR had insignificant R2.
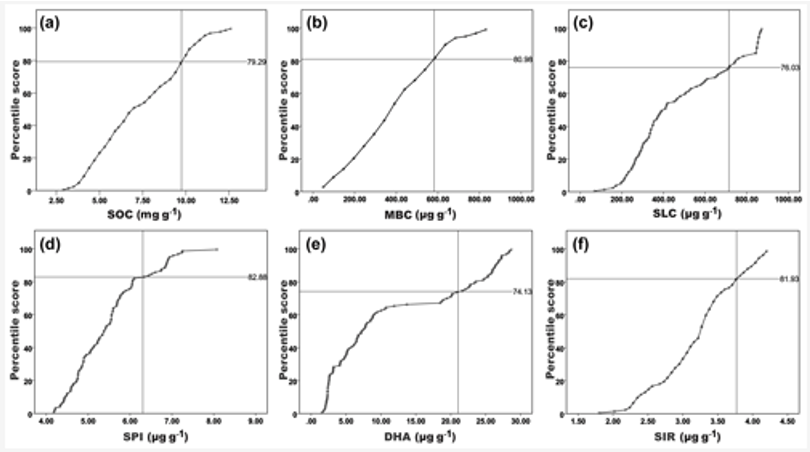
Figure 3: Cumulative normal distribution for scoring the observed soil biological variables in four different nutrient management plots of three different agroclimatic zones.
The scatter plot with the interpolation curve between the actual values (x axis) and the percentile scores (y axis) had a similar trend and relation for all the assessed biological attributes.
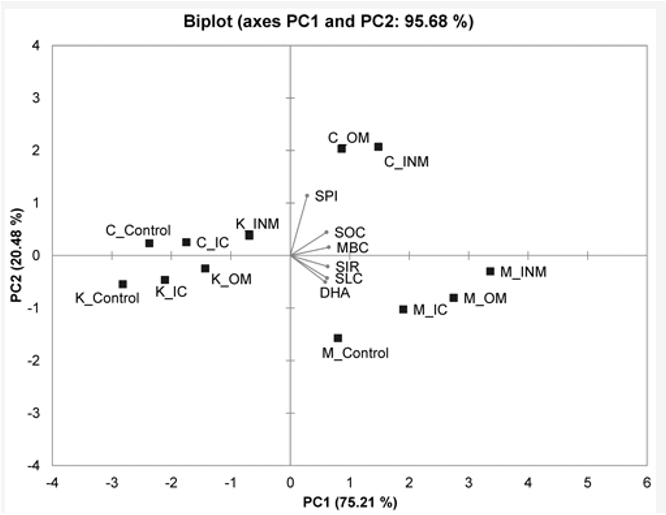
Figure 4: Principal component analysis biplot showing the relation between the soil biological variables in four different nutrient management plots of three different agroclimatic.
Discussion
In the present work, we developed a unitless soil biological quality index to scale the biological properties of soil, to monitor the soil health. We chose six biological indicators, viz. soil organic carbon, soil microbial biomass, soil labile carbon, soil protein index, dehydrogenase activity, and substrate-induced respiration, whose role in soil functioning is well documented. Apart, these variables are known for consistent performance as indicators, relatively quick and simple assessment, and sensitivity to soil disturbances. We measured these six variables from four long-term nutrient management adopted soils Hence, we assume that the data obtained from these soils can be normalized and the impact of nutrient management on these soil biological attributes could scale the SBQI so that the index can be applied to any range of soils of this region. With this background, the SBQI was computed using these six biological indicators.
All these bio-indicators were reported as highest in OM and INM, whereas the IC and control recorded on-par values or sometimes IC was higher than control. Hence, the scale developed using these six variables should differentiate among the OM, INM, IC, and control to each other. We also assume that by comparing those SBQI values of long-term experimental plots to the farmer's soils, it may be possible to predict the biological quality of the soil. This approach was already successfully used to compute the soil quality index (including physical, chemical, and biological attributes)
Conclusions
In the present work, we investigated four different nutrient managements on soil biological attributes, and the difference between them was used to scale a single unitless quantitative measure as an SBQI. Another different models were proposed to compute the SBQIs and each method discriminated the four soil samples accurately, and we could not find any difference among them. There is a general agreement that soil biochemical, microbiological and biological properties are more suitable than physical and/or chemical properties for the purpose of estimating alterations in soil quality and hence soil degradation. To date, most studies have used microbial biomass, soil respiration and enzymatic activities to obtain soil quality indices, whereas less focus has been given to soil fauna (microarthropods and nematodes).
Acknowledgements
The financial support from the Iranian Council of Agricultural and desert Research.
The financial support from the Iranian Council of Agricultural and desert Research.
References
- Andrews, S., Karlen, D., and Mitchell, J.: (2002). A comparison of soil quality indexing methods for vegetable production systems in Northern California, Agr. Ecosyst. Environ., 90, 25–45.
- Casida Jr, L., Klein, D., and Santoro, T.: (1964). Soil dehydrogenase activity, Soil Sci., 98, 371–376.
- Freedman, D. A.: (2009). Statistical models: theory and practice, Cambridge University Press, New York, USA.
- Hurisso, T. T., Moebius-Clune, D. J., Culman, S. W., Moebius-Clune, B. N., Thies, J. E., and van Es, H. M.: (2018). Soil protein as a rapid soil health indicator of potentially available organic nitrogen, Agric. Environ. Lett., 3, 180006.
- Jenkinson, D. S. and Powlson, D. S.: (1976). The effects of biocidal treatments on metabolism in soil—V: A method for measuring soil biomass, Soil Biol. Biochem., 8, 209–213.
- Mandal, U. K., Ramachandran, K., Sharma, K., Satyam, B., Venkanna, K., Udaya Bhanu, M., Mandal, M., Masane, R. N., Narsimlu, B., and Rao, K.: (2011). Assessing soil quality in a semiarid tropical watershed using a geographic information system, Soil Sci. Soc. Am. J., 75, 1144–1160.
- Masto, R. E., Chhonkar, P. K., Singh, D., and Patra, A. K.: (2008). Alternative soil quality indices for evaluating the effect of intensive cropping, fertilisation and manuring for 31 years in the semi-arid soils of India, Environ. Monit. Assess., 136, 419–435.
- Moebius-Clune, B., Moebius-Clune, D., Gugino, B., Idowu, O., Schindelbeck, R., and Ristow, A.: (2016). Comprehensive assessment of soil health, 3.2 ed., The Cornell Framework Manual, 3.1 edn., Cornell University, Ithaca, NY.
- Nussey, D. H., Froy, H., Lemaitre, J.-F., Gaillard, J.-M., and Austad, S. N. (2013). Senescence in natural populations of animals: widespread evidence and its implications for bio-gerontology. Ageing Res. Rev. 12, 214–225.
- Pearson, K.: (1895). Note on regression and inheritance in the case of two parents, P. R. Soc. London, 58, 240–242.
- Walkley, A. and Black, I. A.: (1934). An examination of the Degtjareff method for determining soil organic matter, and a proposed modification of the chromic acid titration method, Soil Sci., 37, 29–38.
- Wold, S., Esbensen, K., and Geladi, P.: (1987). Principal component analysis, Chemometr. Intell. Lab., 2, 37–52.
Citation: Hamid kheyrodin. (2022). A New Mathematical Model for the Study of Soil Microbiology and Biology Activities. Archives of Nutrition and Public Health 4(1).
Copyright: © 2022 Hamid kheyrodin. This is an open-access article distributed under the terms of the Creative Commons Attribution License, which permits unrestricted use, distribution, and reproduction in any medium, provided the original author and source are credited.

