Research Article
Volume 6 Issue 1 - 2024
Mitigation and Adaptation strategies for Global Warming & Climate Change
Formerly Chief Technical Advisor – WMO/UN & Expert – FAO/UN Convenor Forum for a Sustainable environment Hyderabad, Telangana State, India
*Corresponding Author: Dr. Sazzala Jeevananda Reddy, Formerly Chief Technical Advisor – WMO/UN & Expert – FAO/UN Convenor Forum for a Sustainable environment Hyderabad, Telangana State, India.
Received: January 09, 2024; Published: March 26, 2024
Abstract
Mitigation applies to “fictitious” global warming. However, so far scientific community has not established a quantitative relationship between greenhouse gases and temperature except hypothetical deductions. Adaptation applies to natural variability in climate change, like agriculture planning and water resources planning. However, mitigation can be carried out through land use and land cover changes. There is little chance with unabated population growth. In this article issues related to global warming & climate change are discussed in relation to weather events. Under mitigation strategy some proposed to put sunshade and reflecting cooling glass in the orbit to bring down carbon dioxide that increases linearly with human population. The fact is both increased non-linearly. Here by covering the sky it creates several negative impacts not only on climate system but also on weather system that includes total solar radiation from the Sun and net radiation from the Earth; also these in turn impact rainfall, coldwaves, temperature, etc. This in turn affects agriculture, water resources, etc. Global governments are pushing to reduce carbon/greenhouse gases emissions without achieving a quantitative relationship between them. El Nino and Polar Vortex play opposite role and yet reports highlighting warming. The fictitious global warming invariably referred to climate change. Climate change is dominated by natural rhythmic variations which are not in human control: for example Indian annual and southwest monsoon rainfall presented 60-year cycle [and in such cases truncated data series may lead to false conclusions]. Tree Rings data series in Brahmaputra river catchment area clearly followed the 60-year cycle, etc. However, the cyclic periods vary, for example Asmara in Eritrea presented 22-year cycle and Durban in South Africa presented 66 & 22 year cycles. Undivided Andhra Pradesh rainfall in India presented 132 year cycle, which is double to Durban cycle. However, the southwest and northeast monsoons rainfall presented 56 year cycle but in opposite phase. The cyclones in Bay of Bengal presented the southwest monsoon pattern. Study of natural variability under climate change serves the adaptive measures in agriculture and water resources study.
Keywords: Climate Change; Global Warming; Carbon Dioxide; El Nino; Polar Vortex; Western Disturbances; Weather; Agriculture and Water resources
Introduction
Earth’s climate is dynamic and it is always changing through the natural cycles [and they are beyond human control]. What we are experiencing now is part of this system. The word climate change is highly misused. With the unabated population growth and to meet their needs under the new lifestyles based on innovative technologies, local and regional environments were/are modified and thus they influence the natural cycles in climate at local and regional scales is represented by trend.
People of all walks of life make statements attributing weather aberrations to global warming forgetting the fact that “When was, the period, in human history in which some person, in some location or other, wasn’t feeling that some recent day, month or season has been very unusual in some dry, wet, hot, or cold?” Several civilizations have gone in to the history.
The theory is that there is global warming. Global warming influences ice melt and thus raise in sea levels and thus influences the habitats along the coastal zones and thus affect environment. Global warming influences monsoons and thus global water cycle and thus water resources availability and thus affects agriculture, etc. The question is: Is it a fact? The article tries to answer these.
Weather is basically the way the atmosphere is behaving, mainly with respect to its effects upon life and human activities. Weather is not the same everywhere. Perhaps it is hot, dry and sunny today where you live, but in other parts of the world it is cloudy, raining or even snowing.
Climate is the average weather pattern at a place. In most places, weather can change from minute to minute, hour to hour, day to day, season to season and year to year. Climate however, is the average of such weather over time and or space. An easy way to remember the difference is that “climate is what you expect, like a very hot summer, and weather is what you get, like hot day with pop-up Thunderstorms”.
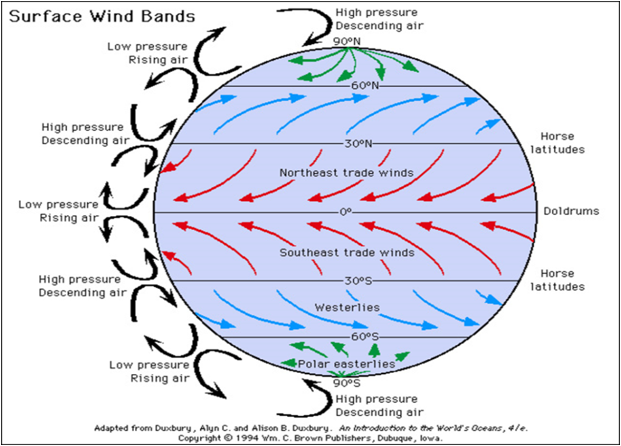
Climate system as defined by IPCC is presented in Figure 1a, which includes Atmosphere, Hydrosphere, Cryosphere, Land Surface, & Biosphere and Figure 1b presents the wind systems from equator to poles. All these play important role on weather such as rainfall, temperature, radiation, etc.
Researchers have been rarely differentiating between weather and climate change/global warming. Global warming is fictitious component of weather events. The major components of “climate change” are as follows:
Climate Change consists of: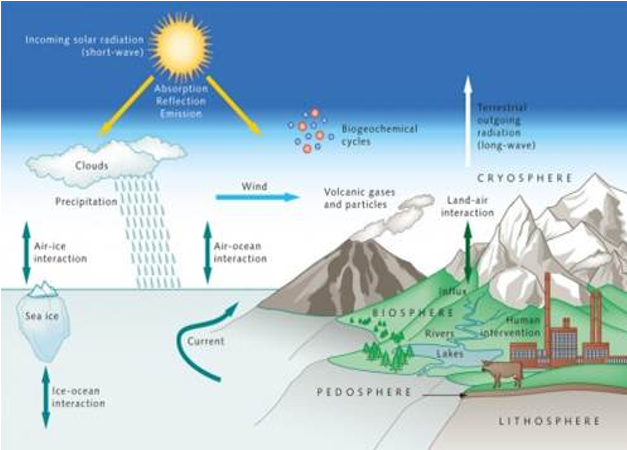
- Natural Variability
(1a) Irregular Variations – Inter-annual & Intra-seasonal variations
(1b) Systematic Variations - Rhythmic Variations or Cyclic Variations - Human Induced Variations
(2a) Greenhouse Effect Component – more than half of the trend
[According to IPCC]
(2a-i) Anthropogenic Greenhouse Effect
(2a-ii) Aerosols Effect, etc.
(2b) Non-Greenhouse Effect Component – less than half of the trend [according to IPCC] -- [it is Land Use & Land Cover Changes]
(2b-i) Urban-Heat-Island Effect – Warming Effect
(2b-ii) Rural-Cold-Island Effect – Cooling Effect

Figure 1a: Climate System as defined by IPCC: -- Atmosphere, hydrosphere, cryosphere, land surface, biosphere, cryosphere, land surface, biosphere.
The following are few headlines on 4-1-2024:
- Winter to finally show up in January as El Nino bested by Polar Vortex
- Sweden sees coldest weather in 25 years
- Nor ’wester to blast East with first significant snow in 2 years from New York to Washington
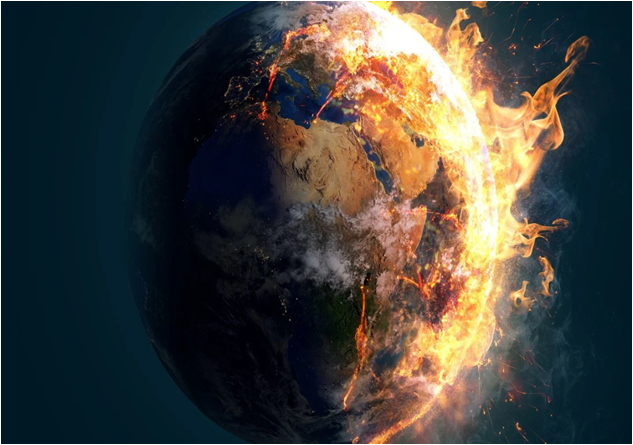
- Researchers recently completed the first simulation of runaway greenhouse effect. Figure 2 presents runaway greenhouse effect world look like on the Earth is getting
- A message from plants: America and Canada is getting a lot warmer, new analysis says.
Here few important issues one must remember before attributing to climate change, namely the increased risks are primarily to population and urbanization with huge structures and also, destruction of natural resources. The below report did not used the word climate change and said it is usual phenomenon [Reddy, 2019a].
In January 2024, a series of atmospheric river storms caused high surf and flooding that left beaches in shambles and destroyed sections of piers in the seaside town of Capitola and in Seacliff. During the current storm, the San Francisco Bay Area coast could see waves up to 40 feet in some locations.
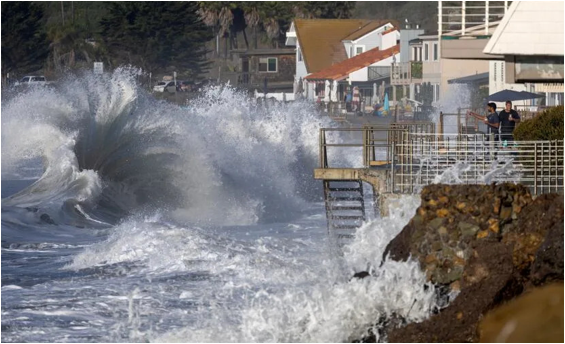
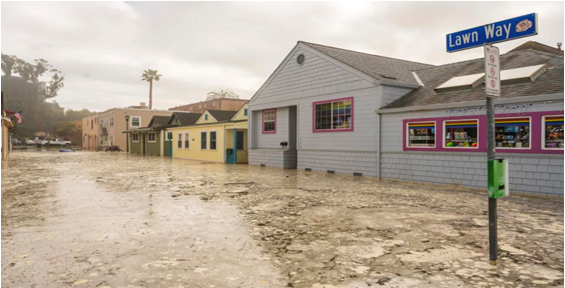
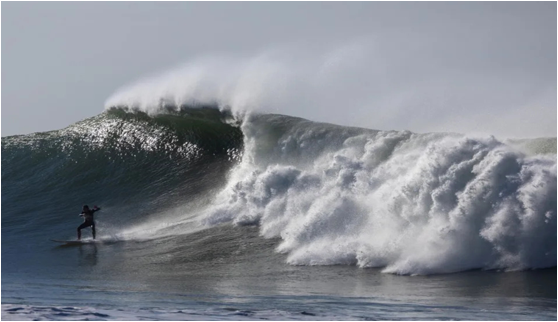
The National Weather Service issued a warning for residents to stay away from rocks, jetties, piers and other waterside infrastructure. In Southern California, the waves aren't expected to be as big, but high surf is expected through Saturday, meteorologists say. Figure 3a presents ‘huge waves’ damage homes, causes injuries along California coast [Karen Garcia, Ashley Ahn, Christian Martinez, December-28, 2023]. California’s first huge swells of the winter are wreaking havoc on the state’s coastline as an incoming atmospheric river storm forces evacuations amid flooding of beach and coastal roads. The extreme weather has been blamed for several injuries, ocean rescues, flooding [Figure 3b] and evacuation orders at coastal cities through the state. Ventura County was particularly hard hit. [Figure 3c] presents the high surf in Northern California isn't unusual for this time of year, meteorologists say. All these are weather events.

Figure 3a: Men watch from a balcony in Faria Beach as huge waves crash on the shore in Ventura. (Brian van der Brug/Los Angeles Times).

Figure 3b: The streets are flooded in Capitola on Dec. 28 as powerful surf is rolling onto beaches on the West Coast (Nic Coury/AP).

Figure 3c: A surfer rides a wave at Surfer's Point on Thursday in Ventura. (Brian van der Brug/Los Angeles Times).
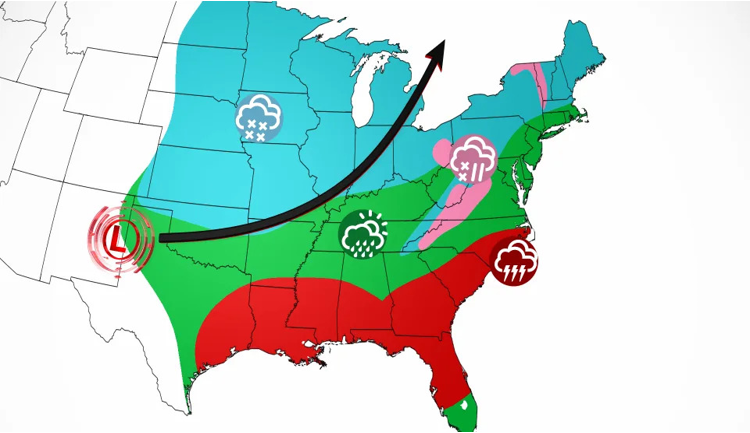
A weather event for 2024: A winter storm [Figure 3d] is ploughing through the mid-Atlantic and Northeast Saturday [6 January, 2024], and there’s another stronger one nipping at its heels that will affect a much wider area of the US. The first storm will unleash up to a foot of snow through Sunday that could cause travel disruptions for the millions currently under winter storm alerts. Freezing rain fell throughout early Saturday in the interior mid-Atlantic, including parts of Virginia and North Carolina where enough ice accumulated to make driving dangerous. Heavy snow reached the interior Northeast in the late morning Saturday. A couple of inches of snow were already reported in central Pennsylvania by Saturday afternoon, ending the 346 day-long wait in the area for widespread significant snow.
Allison Chinchar, CNN on January 8, 2024: “A massive winter storm puts nearly 70 million people at risk for severe weather” -- people across the Gulf Coast and Southeast are at risk. Days after the season’s first big winter storm, another storm is on the move and is expected to bring heavy snow, blizzard conditions, strong winds, potential tornadoes and serious flooding as it carves a path from the Southwest to the Northeast through midweek. In India such events are not looked at weather event but links to politics. For example: Politics of Cloud Burst… Why recent rains? [Editor's Desk, Tattva News, July 23, 2022]: Not only scientists but also politicians make unscientific statements to get political mileage. One such example is presented by the article’s author as follows:
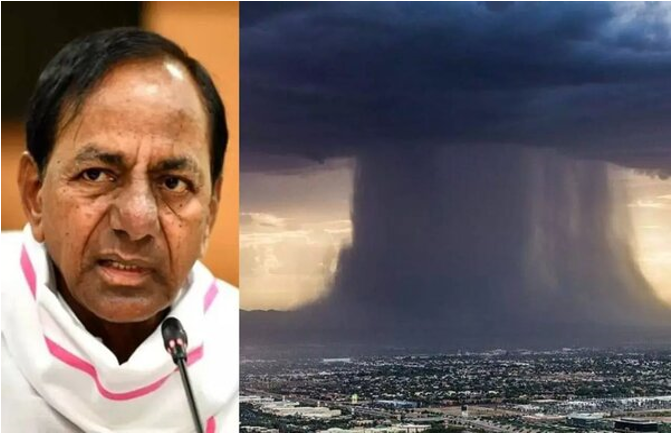
With the heavy rains Kaleswaram [lift irrigation project] pumps were submerged. To overcome the criticism from opposition and public, TRS Chief Minister K Chandrasekhar Rao, during his tour to flood effected zone in Bhadrachalam area, invented a new theory that heavy rains were caused by cloud bust engineered by foreign hand [Figure 3e]. For this he quoted several examples, which are nothing to do with the cloud burst theory. He cited Uttarkhand 2013 flood ravage. In fact this is human induced destruction. Hardly 10 pilgrims were dead with the heavy down-pore in situ. But the gushing water in the steep slope in the river washed away the huge structures/property and killed more than 10,000 people due to lapses from the government. Structures were built in the river. This is same with Srinagar, Mumbai, Chennai, Hyderabad, etc.
He also cited China Olympics. Here the organizers of Olympics to avoid rains in the place of games, conducted cloud seeding in the upwind side. They were successful but farmers fought with the government on this. Low pressure systems give copious rains on its path. AP initiated cloud seeding operations. The seeding firm started seeding low pressure system. This affected the rains downwind path. When I raised this issue in the technical committee meeting in JNTUH with the firm, they simply said that it is not part of our agreement. Then I sent a mail to Chief Minister, (Late) Dr. Y. S. Rajashekara Reddy, explaining the negative impacts of seeding low pressure systems – reduction in rainfall on the downwind direction of seeding zone –. Government closed the project, though Agriculture Minister put tender for five more years, this was not approved.
IMD report observed that the present heavy rains were associated with “The Madden – Julian Oscillation – a travelling pattern that propagates eastward at approximately 9 to 18 mph” — Oscillation means cold followed by warm or wet followed by dry. This showed patches of clouds that caused heavy rains. It formed in Arabian Sea moved to Telangana State via Coastal Gujarat and Maharashtra around Godavari birthplace. This later moved to northwards clearing rains in TS with a system forming in Arabian Sea and moving towards AP via Karnataka in a southwest to northeast direction. This is a natural system, as M-J Oscillation, while moving from Arabian Sea gather moisture to precipitate heavily on its way in patches and not continuity way unlike monsoon rains or cyclonic rains. Here one important point: While I was with ICRISAT, I developed a thumb rule – when low pressure system persists in Bengal/Kolkata region, Hyderabad will be dry and vice versa.
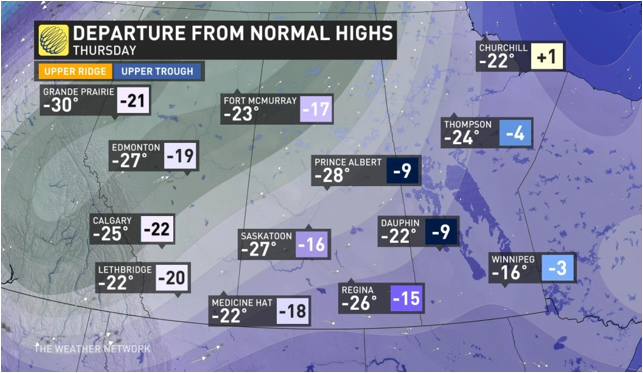
An Arctic outflow reminiscent of La Niña: A strong low will head inland on Tuesday, bottling up the coldest air in the northern reaches of the province. However, by Thursday, a ridge of high pressure building in Alaska will push that frigid air all the way to B.C.'s coast and send temperatures plunging. This sort of pattern would be fairly typical during a La Niña winter, so to see this happen during an El Niño winter is odd, to say the least. Readings will begin to drop on Thursday morning, but the dense Arctic air won't fully reach the South Coast until Thursday evening, sending temperatures well below the seasonal mark. Severe cold snap defies El Niño, brings extreme chill, snow to the Prairies [Forecast Centre, Tue, January 9, 2024 – Figure 3f]. The polar vortex will drive this rapid change in wintry fortunes across the western half of Canada. This large-scale circulation high above the Arctic acts like a fence, keeping the bitterest chill confined to the higher latitudes. When the polar vortex weakens and grows unstable, those frigid temperatures can spill south.
Results and Discussion
Carbon Dioxide vs Temperature vs population
Let me start with two articles that presented different viewpoints on temperature and carbon dioxide. One such article refers to “How we know humans cause global warming: A brief history of climate science” [Fact check, Kate S. Petersen, USA TODAY]. No one has shown that human CO2 emissions drive global warming. Ian Plimer, a skeptic of human-driven climate change, speaking at the Australian Conservative Political Action Conference in 2022. "Game over. We are dealing with a fraud. He exposes the monumental fraud that is 'human-induced global warming' in just two minutes: 'No one has ever shown that human emissions of carbon dioxide drive global warming. And if it could be shown, then you would have to show that the 97% of emissions which are natural do not drive global warming.”
Let me start with two articles that presented different viewpoints on temperature and carbon dioxide. One such article refers to “How we know humans cause global warming: A brief history of climate science” [Fact check, Kate S. Petersen, USA TODAY]. No one has shown that human CO2 emissions drive global warming. Ian Plimer, a skeptic of human-driven climate change, speaking at the Australian Conservative Political Action Conference in 2022. "Game over. We are dealing with a fraud. He exposes the monumental fraud that is 'human-induced global warming' in just two minutes: 'No one has ever shown that human emissions of carbon dioxide drive global warming. And if it could be shown, then you would have to show that the 97% of emissions which are natural do not drive global warming.”
Another report says that more than a century of experimental and observational research by generations of scientists shows that modern global warming is driven by greenhouse gases emitted by human activity. Scientists know that natural CO2 emissions are not driving modern global warming because they are reabsorbed by natural "carbon sinks." However, additional emissions by humans have resulted in excess greenhouse gas accumulation in the atmosphere - driving global warming. -- Excess CO2 emissions are accumulating in the atmosphere because Earth's natural carbon sinks do not have the capacity to absorb all of the extra CO2 that humans emit. After decades of accumulation, atmospheric CO2 levels have increased by 50% since pre-industrial times, rising to levels unprecedented in hundreds of thousands of years, according to the NOAA. Fact check: Humans are responsible for a significant amount of CO2 in the atmosphere
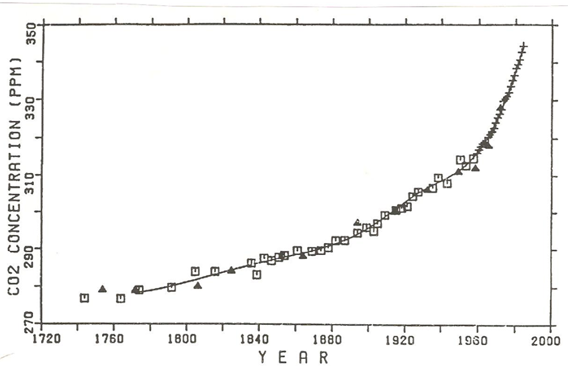
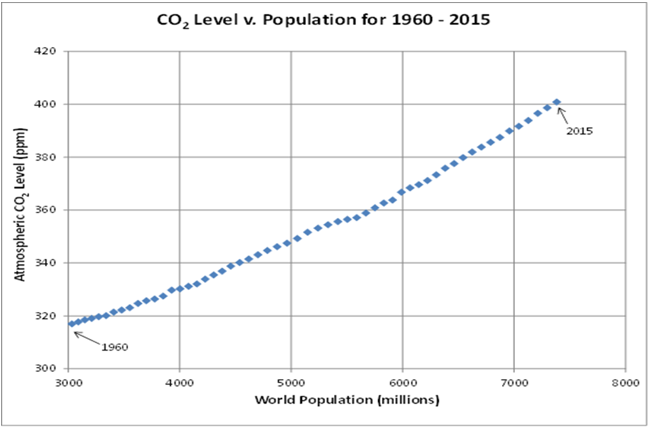
Here the basic issue is human emissions of Carbon Dioxide. Figure 4a presents the population growth in the past 200 years [1720 to 2020] which presents a non-linear increase – with the time births are more and deaths are less. People take in air and release carbon dioxide. At the same time carbon sink principally forests drastically cut down. Figure 4b presents a relationship between carbon dioxide and population growth during 1960 to 2015. This shows linear increase in carbon dioxide with population growth. In the Southern Hemisphere population and carbon dioxide are lesser than those in the Northern Hemisphere. When we average for the globe, it presents imbalance.
Forests have been considered as major Carbon dioxide sinks and humans follow the anti-thesis. The global forest cover decreased with the time under increased population pressure on the land. Forest animals, those that have been releasing methane, also decreased with the time with forest covers diminishing with the exception of few countries. The total forest cover in India in 2023 is 718789 square kilometres which is 21.7% of the total geographical area of the country. FAO global forest resources assessment of 2020 is 4.06 million hectares [10 million acres], which is 31%. In 1700 it was 52%, 1900 it was 48%, 1950 it was 44%. Area by country: Russia-815, Brazil – 407, Canada – 360, USA – 310, China – 280, Australia – 134, Congo – 92, Indonesia – 92, Peru – 72 & India – 72, million square kilometres.
El Nino, La Nina, Polar Vortex, lack of snowfall: Warm & Cold
‘Weather Complex’ January forecast shows El Nino, Polar Vortex, lack of snowfall coming into play this winter. Andrew Wulfeck on December 22, 2023. A factor that NOAA forecasters said could lead to changes in its January and 3-month outlook is the influence of the polar vortex. A question that forecasters face every year is when will polar vortex break down, which usually sends cold air spewing into more southern latitudes. When this arctic air makes it into Canada and the U.S., it can lead to some of the harshest winter conditions and drop temperatures below zero. If the cold air combines with moisture, communities can see significant snowfall.
‘Weather Complex’ January forecast shows El Nino, Polar Vortex, lack of snowfall coming into play this winter. Andrew Wulfeck on December 22, 2023. A factor that NOAA forecasters said could lead to changes in its January and 3-month outlook is the influence of the polar vortex. A question that forecasters face every year is when will polar vortex break down, which usually sends cold air spewing into more southern latitudes. When this arctic air makes it into Canada and the U.S., it can lead to some of the harshest winter conditions and drop temperatures below zero. If the cold air combines with moisture, communities can see significant snowfall.
A stable Arctic Polar Vortex: "Juda Cohen who studies Polar Vortex, there isn’t a one-to-one correlation between what’s happening with the polar vortex and our weather, and also, there’s a delay," So, you’ve been talking about a sudden stratospheric warming. It takes about two weeks for the effects of the sudden stratospheric warming to impact our weather. Cohen said he believes that cold air will eventually make it to the U.S., but the event will "fall short of its full potential." In other words, cold air is on the way in January, but the exact extent is still unknown. The first month of the year is usually the coldest for much of the United States, with the halfway point of meteorological winter being about Jan. 15. It means Polar Vortex pushes cold air in to Canada & USA but El Nino pushes warmer air in to USA. That means which ever factor dominates create warm or cold conditions in USA. This is nothing to do with the fictitious global warming. This represents weather conditions of irregular variations under climate change.
(i) The effects of climate change are making themselves known as this year hits new records of uncertainty. Climate change has also caused unprecedented ocean warming. Along with global air temperatures, water temperatures also hit a record high, almost reaching 100 degrees Fahrenheit in some locations. – Weather events are attributed to climate change.
This year saw a sweltering summer, with July 2023 being declared the hottest month on record, according to the Copernicus Climate Change Service (C3S). The month's average temperature was 62.51 degrees Fahrenheit, six-tenths of a degree higher than the previous record set in 2019, "The need to reduce greenhouse gas emissions is more urgent than ever before," Petteri Taalas, a professor and the secretary-general of the World Meteorological Organization, said in a statement. "Climate action is not a luxury but a must." "Dr. Kathryn Lesneski of the NOAA told BBC. The ocean is the "most accurate thermometer we have for the actual effect of climate change because it's where most of the heat ends up," Zeke Hausfather, a climate scientist at non-profit research institute Berkeley Earth, told the Times.
(ii) Winter in the Southern Hemisphere is when Antarctic ice is supposed to form. However, this year "growth has been stunted," and the amount of sea ice in the region is "hitting a record low by a wide margin," per The New York Times. "The Antarctic sea ice extent low in 2023 is unprecedented in the satellite record," Liping Zhang, a project scientist at the NOAA's Geophysical Fluid Dynamics Laboratory, wrote in an email to the Times. The previous record low was from 2022, but this year the ice level is approximately 1.6 million square kilometres below last year, CNN reported. "The Antarctic system has always been highly variable," Ted Scambos, a glaciologist at the University of Colorado Boulder, told CNN. "This [current] level of variation, though, is so extreme that something radical has changed in the past two years, but especially this year, relative to all previous years going back at least 45 years." The warmer ocean temperatures are likely mixing into Antarctic waters, preventing ice from forming. Melting ice is a key factor in sea level rise. Ice also serves to reflect back sunlight, helping to regulate global temperatures. How, a big question???
(iii) South-faces freezing temperatures, chance of snow as 2024 approaches. The South will be taking the polar plunge heading into the new year, with temperatures dropping below freezing and snow in the forecast. The same storm that blasted the Plains with near hurricane-force winds and almost a foot of snow that created blizzard conditions is dropping south and east. "This low has been pretty much a troublemaker, wherever it is across the northern Plains now, moving into the south," said FOX Weather Meteorologist Kiyana Lewis. "This cooler air mass filters in behind it, and we'll see a lot of areas, where typically around this time of the year would be associated with warmer weather – Florida being one of those areas that we watch closely towards the end of the week. Look at these lows back into the thirties, low twenties."
These are nothing to do with climate change. They are mostly localized weather condition that presents season to season and or year to year.
Climate Change is not Global Warming
Lapses in data used to define global warming
“Multiple lines of evidence and decades of research show humans are causing climate change”, it is “incorrect statement” and thus hypothetical. Here one must understand that (i) weather is not climate or climate change; and climate change is not global warming but it is one fictitious component of climate change. Temperature is a function of several factors [Figures 1a & b]. Why I said global warming as fictitious is the average of conditions existing over different parts that vary with seasons and years and changes in agricultural patterns and forest covers and urbanization and changing water resources conditions and population growth – variable climate system. Also, IPCC noted that more than half of the trend is associated with greenhouse gases and less than half is associated with non-greenhouse effect that includes changes in land use and land cover. It is argued that Global warming warmed the planet by amplifying Earth's "greenhouse effect" - the process by which greenhouse gases slow the release of heat into space. Scientists determined this through a lengthy process, which included establishing that CO2 is a greenhouse gas, determining that both CO2 and temperatures are increasing, determining that the increase in atmospheric CO2 is due to human behaviour and using this knowledge to accurately predict future warming.
“Multiple lines of evidence and decades of research show humans are causing climate change”, it is “incorrect statement” and thus hypothetical. Here one must understand that (i) weather is not climate or climate change; and climate change is not global warming but it is one fictitious component of climate change. Temperature is a function of several factors [Figures 1a & b]. Why I said global warming as fictitious is the average of conditions existing over different parts that vary with seasons and years and changes in agricultural patterns and forest covers and urbanization and changing water resources conditions and population growth – variable climate system. Also, IPCC noted that more than half of the trend is associated with greenhouse gases and less than half is associated with non-greenhouse effect that includes changes in land use and land cover. It is argued that Global warming warmed the planet by amplifying Earth's "greenhouse effect" - the process by which greenhouse gases slow the release of heat into space. Scientists determined this through a lengthy process, which included establishing that CO2 is a greenhouse gas, determining that both CO2 and temperatures are increasing, determining that the increase in atmospheric CO2 is due to human behaviour and using this knowledge to accurately predict future warming.
It is reported that in the mid-1800s, scientists Eunice Foote and John Tyndall experimentally demonstrated that CO2 is a greenhouse gas. These gases, such as CO2, warm the planet by absorbing radiation otherwise destined for space. Water vapour in the atmosphere is also a greenhouse gas it has special and seasonal variations and follows the rainfall patterns. After absorbing this radiation, CO2 molecules release their own radiation - some of which makes its way into space. But some of it also gets directed laterally to be absorbed by other CO2 molecules or back down to the Earth, effectively trapping warmth in the lower atmosphere. This is affected by clouds/moisture; dust, etc. in the atmosphere.
Solar Radiation released from the Sun that reaches the Earth presented its relation to cube root of rainfall. So also Net Radiation released by the Earth. Scientists have repeatedly confirmed the existence of this physical process. "The theory and mathematics of radiation passing through gases are clearly defined," Michael Roman, a planetary scientist at the University of Leicester, previously told USA TODAY. The greenhouse effect has "been verified by laboratory experiments and meteorological observations." Laboratory experiments rarely replicate environment. The basic question one should ask them is: Is there a mathematical relationship?
Based on the physics of the greenhouse effect and other processes, a certain amount of warming should result from a given increase in atmospheric greenhouse gas concentrations on the Earth. And this is what scientists have observed. "The amount of warming we see matches what we expect based on the increased CO2 we've added," Josh Willis, a NASA climate scientist, previously told USA TODAY. "The timing of the warming matches the timing of the CO2 increase caused by people. Not only that, the timing of global sea level rise matches the CO2 increase." We must not forget the fact that CO2 linearly increasing with population.
So far no agency has presented a relationship between carbon dioxide and temperature but says that successful predictions show climate science is sound. Yet, scientists say that they have successfully leveraged their understanding of greenhouse gas and climate physics to predict future warming far in advance. Climate Science sound but there were no successful predictions as there is no direct one to one relation.
Natural CO2 emissions reabsorbed in 'carbon sinks,' humans tipped the scale. The post also implies that if natural CO2 emissions dwarf human emissions, then human CO2 cannot be the driver of climate change. That is wrong. Currently, around 96% of annual CO2 emissions are natural, according to the 2022 Global Carbon Budget. However, Earth's ecological systems reabsorb natural emissions in “carbon sinks,” such as forests, as part of Earth's carbon cycle, Gavin Schmidt, a NASA climate scientist, told USA TODAY.
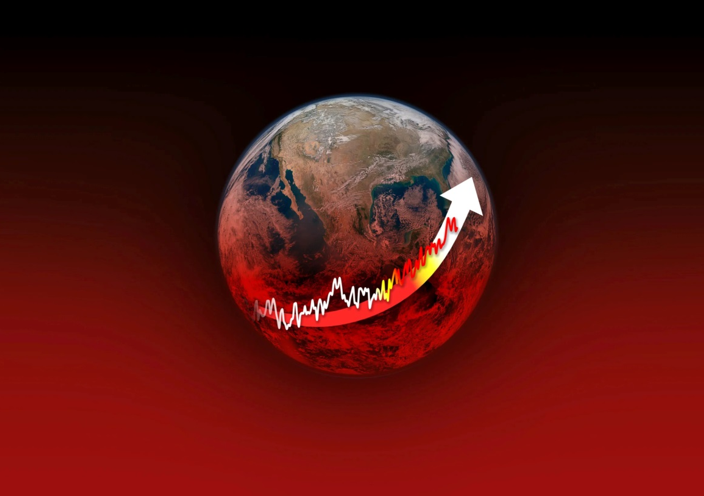
Each year since 2014 stands among the top 10 warmest years since people began keeping track, based on increases in global average temperatures above the previous century, according to NASA and NOAA. Figure 5 presents the temperature march with time – it shows cyclic pattern – white line. The year 2016, which included the influence of a strong El Niño, was the warmest year on record. Then 2020 matched it. Once a series of marine heat waves and another developing El Niño began influencing Earth's temperatures in 2023, it became increasingly clear to the world's scientists that the year was likely to see the biggest increases in average temperatures compared to last century.
The temperature has been influenced by several localized and regionalized factors. These effects were rarely deleted from the greenhouse component and or from land use and land cover changes, that includes urban-heat-island and rural-cold-island effects.
Example, they use weather stations and ocean temperature readings and track how much warmer or colder those temperatures are compared to a set reference period in the past, Schmidt said. The resulting anomalies are then averaged over the globe; in a second method, satellite data that is close to surface air temperature is averaged together, and then adjusted for gaps in resolution or data. The anomalies also are the most robust way to look at this data, he said. A third method reanalyses by plugging satellite and other data into a weather model that calculates an average; the best analyses use all three methods to examine the data, Schmidt said. This shows the lacunae in the data sets. [This article originally appeared on USA TODAY: 2023 was Earth']
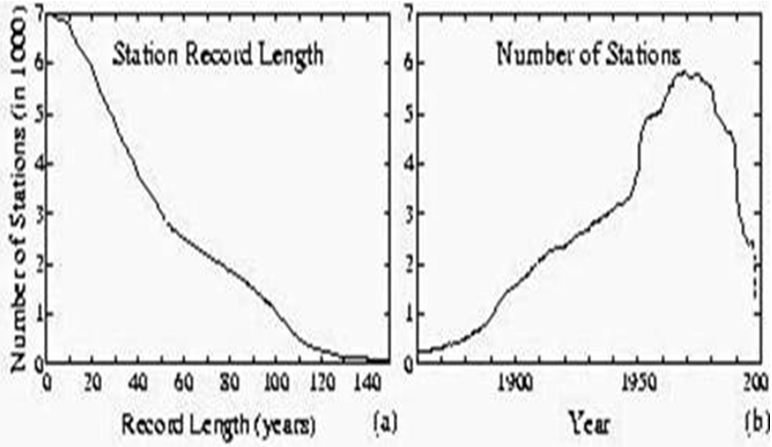
Figure 6presents the station record length and number of stations. This is a major flaw in the estimation of average temperature anomaly over the globe. Station record length varied between 10 to 140 years and number of stations has been increased from few to around 6000; and with the satellite data coming into play the stations decreased to 1000 stations. Using such data series we talk of global warming [Figure 5] and thus need to bring down greenhouse gases without showing the realistic relation between temperature and greenhouse gases.
Sunshade in the orbit vs Climate
Scientists want to put a massive ‘sunshade ’in orbit to help fight climate change – refers to global warming [Leonard David, December 19, 2023]. This has a major impact on the climate system and thus life forms on the Earth and as well on climate change. This system not only reduces solar radiation emitted by the Sun that reaches the Earth but also net radiation emitted by the Earth. Global Solar radiation follows the sunspot cycle [11-years) and its multiples of 22 & 44-years [Reddy et al., 1977]. The shade may effects this pattern over a time. Also it helps to reflect solar radiation that influences Stratosphere Ozone. Incoming total solar radiation from the Sun is a function of sunshine hours and as well cube-root of rainfall. Same is the case with net radiation emitted by the Earth -- that effects the temperature & humidity [Reddy (1974, 1987.1995a&b), Reddy & Rao (1977), Reddy et al., (1977)]. Agriculture is a function of Rainfall & temperature - through natural variability in precipitation/rainfall cause droughts and floods [Akumanchi, et al. (2009), Reddy (1983a&b, 1985, 2000, 2002, 2004, 2007, 2002a & b, 2019c, 2019d, 2020a, 2021e), Reddy et al. (1984), Reddy & Timberlake (1987), Williams, et al. (1985)]. Human health and crops effected by cold waves conditions [De et al (2005), Reddy & Rao (1978)], Reddy (2022). Wet bulb temperature is a function of dry bulb temperature and relative humidity; & Precipitable water in the atmosphere is a function of wet bulb temperature [Reddy, 1976]. It may be influenced by the natural variability in rainfall & temperature [Reddy, 1977, 1984a & b, 1986, 1993, 2008, 2016, 2017, 2019a&b, 2021a b, c. d & e; BRS & USNAS (2014), WMO (1966)]. Etc.
Scientists want to put a massive ‘sunshade ’in orbit to help fight climate change – refers to global warming [Leonard David, December 19, 2023]. This has a major impact on the climate system and thus life forms on the Earth and as well on climate change. This system not only reduces solar radiation emitted by the Sun that reaches the Earth but also net radiation emitted by the Earth. Global Solar radiation follows the sunspot cycle [11-years) and its multiples of 22 & 44-years [Reddy et al., 1977]. The shade may effects this pattern over a time. Also it helps to reflect solar radiation that influences Stratosphere Ozone. Incoming total solar radiation from the Sun is a function of sunshine hours and as well cube-root of rainfall. Same is the case with net radiation emitted by the Earth -- that effects the temperature & humidity [Reddy (1974, 1987.1995a&b), Reddy & Rao (1977), Reddy et al., (1977)]. Agriculture is a function of Rainfall & temperature - through natural variability in precipitation/rainfall cause droughts and floods [Akumanchi, et al. (2009), Reddy (1983a&b, 1985, 2000, 2002, 2004, 2007, 2002a & b, 2019c, 2019d, 2020a, 2021e), Reddy et al. (1984), Reddy & Timberlake (1987), Williams, et al. (1985)]. Human health and crops effected by cold waves conditions [De et al (2005), Reddy & Rao (1978)], Reddy (2022). Wet bulb temperature is a function of dry bulb temperature and relative humidity; & Precipitable water in the atmosphere is a function of wet bulb temperature [Reddy, 1976]. It may be influenced by the natural variability in rainfall & temperature [Reddy, 1977, 1984a & b, 1986, 1993, 2008, 2016, 2017, 2019a&b, 2021a b, c. d & e; BRS & USNAS (2014), WMO (1966)]. Etc.
Another study relating to ‘Cooling glass’ could fight climate change by reflecting solar radiation back in to space. They said laboratory tests have shown it to reflect up to 99% of solar radiation back to space??? It is a Dangerous Scenario???
Systematic/cyclic variations – Rainfall & Temperature
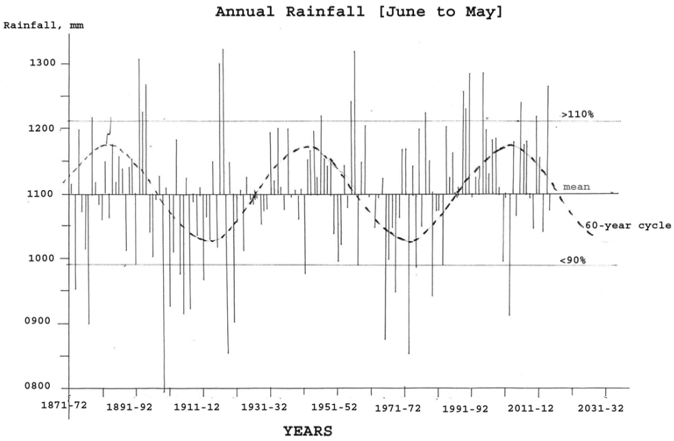
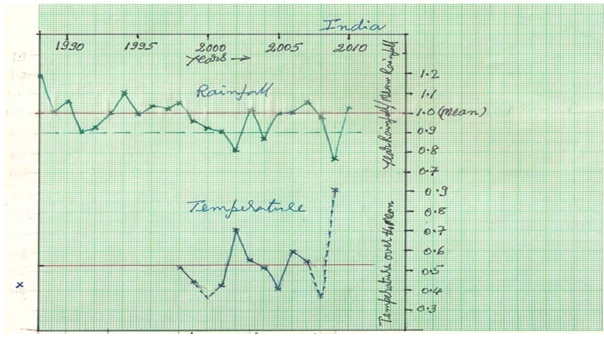
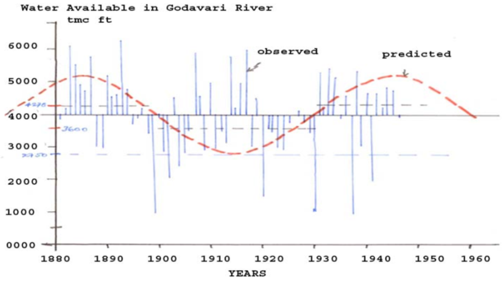
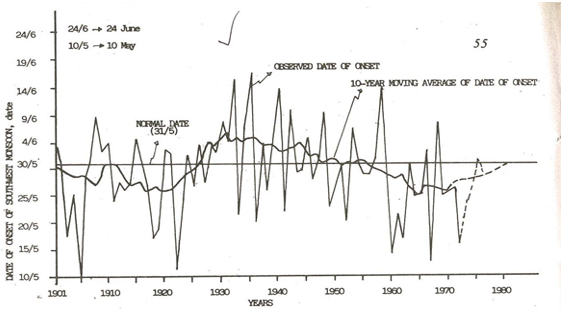
Reddy (1993, 2019a & b, 2022, 2023): Rainfall is the major contributor for water resources & agriculture. The author studied the rainfall of India, Brazil, Mozambique, Ethiopia, and few others such as Malawi, Zimbabwe, Botswana, South Africa, etc. rainfall. They showed cyclic pattern but they are different over different countries and over different parts of the same country. No trend was observed. Figure 7a presents annual rainfall of India with 60-year cycle [southwest monsoon rainfall that forms 78% of annual showed the same; and Figure 7b presents the annual average rainfall vs annual average temperature in India – drought condition increased temperature; Figure 7c presents water flows in Godavari River with 60-year cycle; and Figure 7d presents the dates of onset of southwest monsoon over Kerala Coast and 10-year moving average – WMO (1966) presented moving average technique to identify systematic pattern in the data series. BRS & USNAS (2014) presented the same for global average temperature that shows 60-year cycle.
Reddy (1993, 2019a & b, 2022, 2023): Rainfall is the major contributor for water resources & agriculture. The author studied the rainfall of India, Brazil, Mozambique, Ethiopia, and few others such as Malawi, Zimbabwe, Botswana, South Africa, etc. rainfall. They showed cyclic pattern but they are different over different countries and over different parts of the same country. No trend was observed. Figure 7a presents annual rainfall of India with 60-year cycle [southwest monsoon rainfall that forms 78% of annual showed the same; and Figure 7b presents the annual average rainfall vs annual average temperature in India – drought condition increased temperature; Figure 7c presents water flows in Godavari River with 60-year cycle; and Figure 7d presents the dates of onset of southwest monsoon over Kerala Coast and 10-year moving average – WMO (1966) presented moving average technique to identify systematic pattern in the data series. BRS & USNAS (2014) presented the same for global average temperature that shows 60-year cycle.
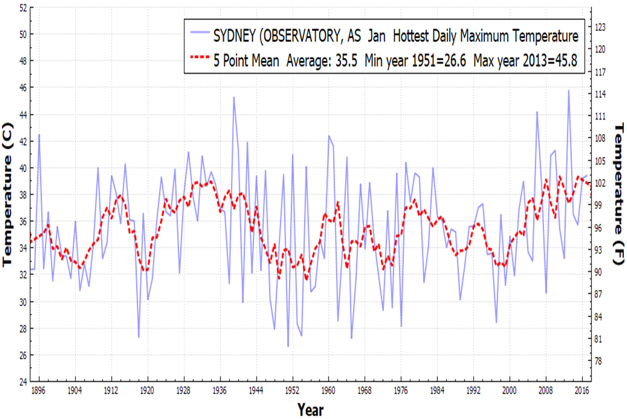
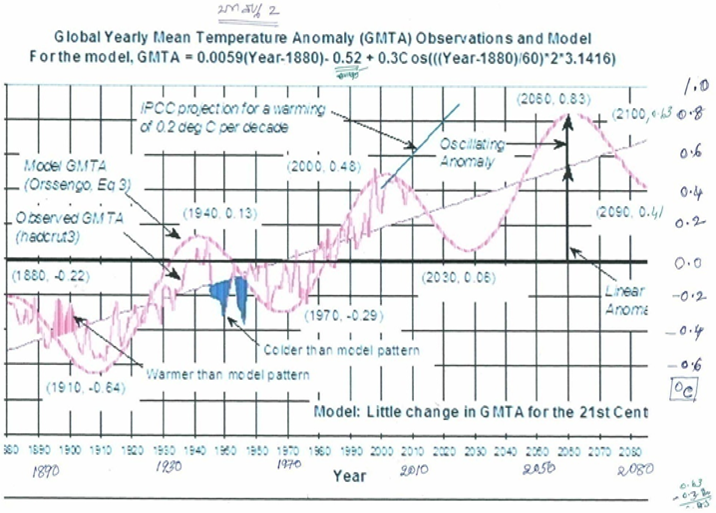
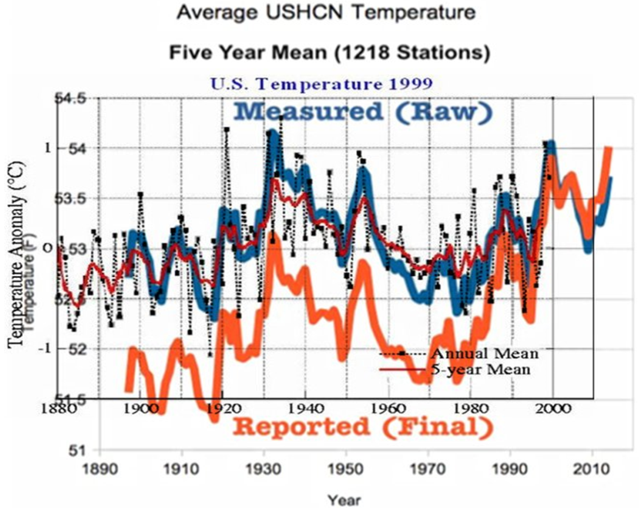
Reddy (2008, 2017): Temperature is one another that significantly influence the agriculture, however adapted to local temperature regimes. Global temperature presented 60-year cycle. Unadjusted data series showed no trend but the adjusted data series showed a trend. This was attributed to several factors -- Reddy (2019b). Adjusted global average annual temperature anomaly [Figure 8a] from 1880 to 2010 presented the natural variability of 60-year cycle and human induced trend. The 60-year cycle [sine curve] varied between – 0.30 + 0.30oC and the trend presented 0.6oC per century. The trend do not represent global warming component alone. It is only 50% of the trend and thus 1951 to 2100, it is 0.45oC – according to IPCC 1951 is the starting year of global warming. USA temperature data unadjusted showed 60 year cycle with no trend [Figure 8b]. Sydney in Australia the maximum temperature followed USA pattern [Figure 8c].

Figure 8a: Global Average Temperature Anomaly: 1880 – 2010; 60- year cycle of Natural variability varied between -0.3 and +0.3°C; Trend [1880 to 2100]: 1.30°C; GW [1951-2100]: 0.45oC; Trend [1850 to 2100]: 1.34°C; GW [1951-2100]: 0.40°C.

Figure 8b: Annual of average USHCN temperature [measured raw data and reported final data [adjusted].
Temperature vs crop production
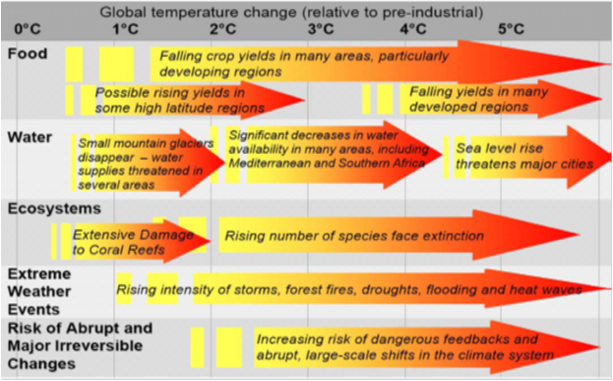
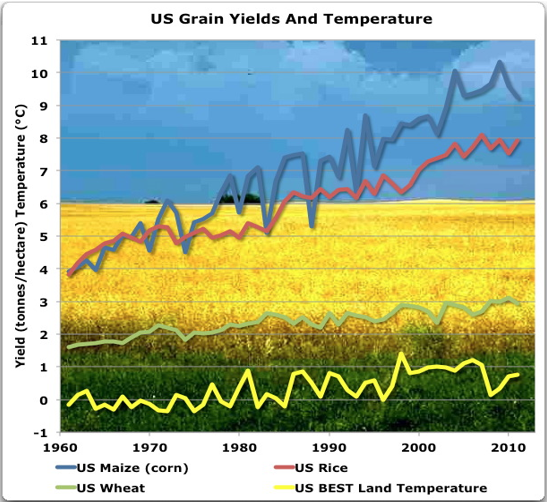
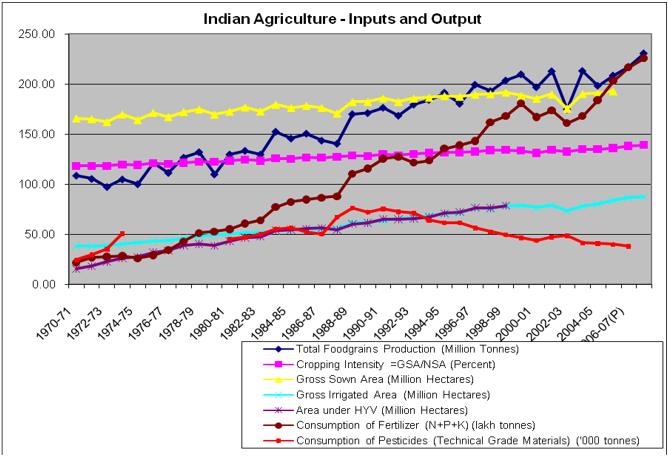
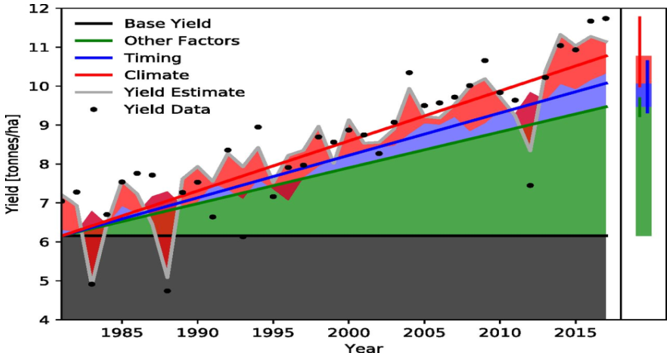
Crops, particularly seeds are adapted to local temperature regime. The crop production relates to water, seeds, and chemical fertilizers. Figure 9a presents IPCC projection on food, water and temperature. This is not seen in the following observed data. Figure 9b presents the US grain yields [Maize (corn), wheat and rice] vs best land temperature. Figure 9c presents Indian Agriculture vs inputs and outputs & Figure 9d presents the USA corn – inputs and outputs. New seed varieties are developed with specific temperature regime. In USA the main issue relates to growing period availability [winter withdrawal and winter onset periods]
Crops, particularly seeds are adapted to local temperature regime. The crop production relates to water, seeds, and chemical fertilizers. Figure 9a presents IPCC projection on food, water and temperature. This is not seen in the following observed data. Figure 9b presents the US grain yields [Maize (corn), wheat and rice] vs best land temperature. Figure 9c presents Indian Agriculture vs inputs and outputs & Figure 9d presents the USA corn – inputs and outputs. New seed varieties are developed with specific temperature regime. In USA the main issue relates to growing period availability [winter withdrawal and winter onset periods]
Heatwaves & Cold waves
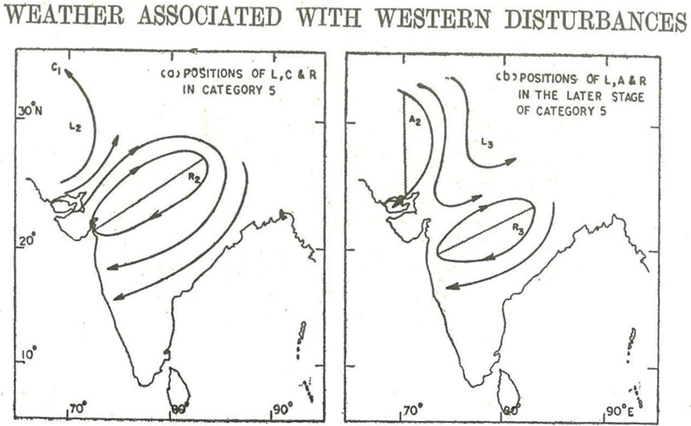
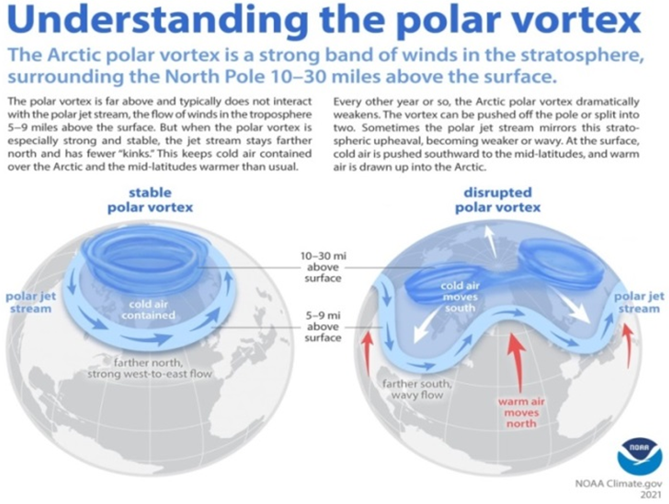
Reddy (2022) and Reddy & Rao (1978): Heatwaves and Coldwaves form part of general circulation of winds. In India [Figure 10a] they are termed as Western Disturbances [coldwaves in winter and heatwaves in summer] for US it is termed as Polar Vortex [Figure 10b]. The movement up and down creates the warm and cold currents. This system counteracted by El Nino and La Nina. In both the cases the systems are not the same over space and time.
Reddy (2022) and Reddy & Rao (1978): Heatwaves and Coldwaves form part of general circulation of winds. In India [Figure 10a] they are termed as Western Disturbances [coldwaves in winter and heatwaves in summer] for US it is termed as Polar Vortex [Figure 10b]. The movement up and down creates the warm and cold currents. This system counteracted by El Nino and La Nina. In both the cases the systems are not the same over space and time.
Western Disturbances [WD] are storms that originate in the Caspian or Mediterranean Sea, and bring non-monsoonal rainfall to northwest India. They are labelled as an extra-tropical storm originating in the Mediterranean, is an area of low pressure that brings sudden showers, snow and fog in northwest India. The disturbance travels from the “western” to the “eastern” direction. These travel eastwards on high-altitude westerly jet streams - massive ribbons of fast winds traversing the Earth from west to east. It arrives with rain and snow in Pakistan and northern India. WD brings winter and pre-monsoon rain and is important for the development of the Rabi crop in the Northern subcontinent. The WDs are not always the harbingers of good weather. Sometimes WDs can cause extreme weather events like floods, flash floods, landslides, dust storms, hail storms and coldwaves & heatwaves in pre-monsoon season killing people, destroying infrastructure and impacting livelihoods. However, WDs are modified in terms of direction in which it moves like storms in Bay of Bengal and Arabian Sea. Examples are shown in Figure 10a.
A polar vortex is a constant, upper-level low pressure area that rotates counter-clockwise at the North Pole and clockwise at the South Pole. The Arctic polar vortex is a band of strong westerly winds that forms in the stratosphere between about 10 and 30 miles above the North Pole every winter. The winds enclose a large pool of extremely cold air. (There is an even stronger polar vortex in the Southern Hemisphere stratosphere in its winter.) The stronger the winds the air inside is isolated from warmer latitudes, and the colder it gets. Figure 10b presents an example.
The western U.S. is bracing for a stormy week to start the new-year 2023-24 as a series of powerful storms gets set to soak the region with drenching rains in the lower elevations and along the coast, as well as feet of snow to the higher elevations of the Sierra Nevada and Cascades from California to Washington State. Some of them are presented earlier sections.
Arctic & Antarctic Sea Ice
Reddy (2022): The average Antarctic Sea Ice extent of 1981-2010 [million km2] the minimum recorded in between February-March and maximum in between September-October varied between around 2.5 and 20.0 million of km2 – seasonal variation. However, the important issue here is that there is no change in these with years. The satellite data of 1978 to 2014 showed the minimum varied between 2.25 (1975) and 3.65 (2012) and the maximum varied between 17.5 (1986) and 19.2 (2014) which means 1.4 and 1.7 million of km2.
Reddy (2022): The average Antarctic Sea Ice extent of 1981-2010 [million km2] the minimum recorded in between February-March and maximum in between September-October varied between around 2.5 and 20.0 million of km2 – seasonal variation. However, the important issue here is that there is no change in these with years. The satellite data of 1978 to 2014 showed the minimum varied between 2.25 (1975) and 3.65 (2012) and the maximum varied between 17.5 (1986) and 19.2 (2014) which means 1.4 and 1.7 million of km2.
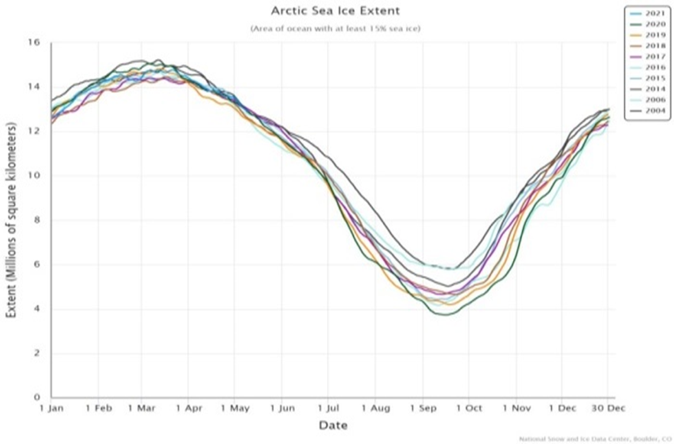
Seasonal march of “Arctic Sea Ice Extent” in millions of km2 for 2014-2021 & 2004 & 2006 the Maximum is reached in March and minimum in between September – October. However there is no change or little change in these with years but they varied between 4 and 15 million of km2. In the case of minimum Arctic is higher than Antarctic and in the case of maximum Arctic is lower than Antarctica in sea ice extent. Most important point: During April-May-June the year to year changes is the lowest; September-October is the highest and next in between February – March. These clearly suggest the fact that there is no global warming impact on these both at Arctic and Antarctic. They systematically followed the Sun. Arctic Ice Volume during 1979-2015 also showed minimum of year to year variation during April-May-June [Figure 11a]. The changes are associated with local weather conditions. Al Gore received part of Nobel Prize for saying in five years the ice is zero. After receiving the award pronounced error in his pronouncement.
Reddy (2017): In 2014 a study of 2181 glaciers in Himalayas from 2000 to 2011 showed 86.6% were not receding. This information was presented in Indian Parliament by the Minister of Forests & Environment and Climate Change after his return to India from attending Paris meet in December 2015. Heavy snowfall was recorded for few days at that time in Himalaya zone.
Major cities are sinking??
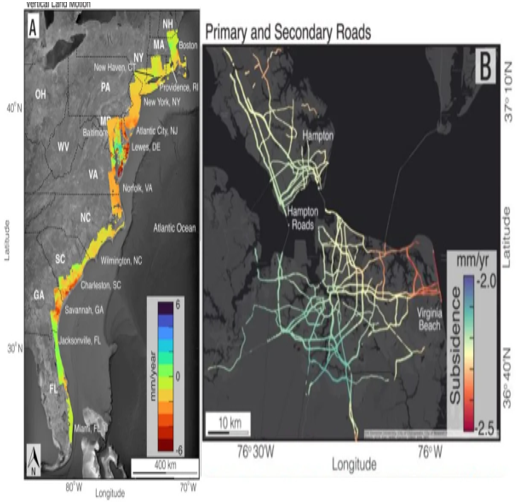
According to Robert Lea satellite observations show major cities on US East Coast are sinking [January 5, 2024]. Figure 11b is based on the data collected by numerous satellites have shown that major cities and population centres across the U.S. East Coast are sinking. Land sinking, or "subsidence," as seen by these satellites, is dangerous because it can undermine the foundations of buildings, potentially causing collapse. These can also damaging roads as well as gas and water lines. When coupled with rising sea levels caused by human-driven climate change, subsidence in coastal regions can increase the risk of flooding and worsen subsequent damage.
According to Robert Lea satellite observations show major cities on US East Coast are sinking [January 5, 2024]. Figure 11b is based on the data collected by numerous satellites have shown that major cities and population centres across the U.S. East Coast are sinking. Land sinking, or "subsidence," as seen by these satellites, is dangerous because it can undermine the foundations of buildings, potentially causing collapse. These can also damaging roads as well as gas and water lines. When coupled with rising sea levels caused by human-driven climate change, subsidence in coastal regions can increase the risk of flooding and worsen subsequent damage.

Figure 11b: (Right) A map of vertical land motion on the East Coast (left) primary, secondary, and interstate roads on Hampton Roads, Norfolk, and Virginia Beach, Virginia with red and yellow indicating areas of sinking
Together with Virginia Tech Earth Observation and Innovation Lab Associate Professor Manoochehr Shirzaei, Ohenhen and colleagues collected a huge amount of data from space-based radar satellites to build digital maps of terrain. They then measured millions of subsidence occurrences over many years, following up by constructing some of the first-ever high-resolution images of sinking land. The team's maps showed that a large number of U.S. East Coast areas sinking by at least 2 mm (0.08 in) per year. Additionally, the scientists found areas along the mid-Atlantic coast, amounting to over 1,400 square miles (3,626 square kilometres) that are sinking by 5 mm (0.2 in) per year or more. The current rate of global sea-level rise is around 4 mm (0.16 in) per year. These are dangerous inferences.
Natural variability at country, state and station levels
At Country level [Reddy, 1993, 2017, 2019c]. Annual and Southwest Monsoon season rainfall of India presented 60-year cycle [Figure 7a] – 30 years below the average part and the next 30 years above the average part in majority of the years. This was also evident in tree rings in Brahmaputra River catchment area, more particularly drought or below average part of 60-year cycle. Reddy (2019d): Flood proneness in river flows in Chenab, Ravi & Beas in northwest India also followed this pattern [Reddy, 2016]. The water flows in Godavari River in South India followed this pattern [Figure 7c].
At Country level [Reddy, 1993, 2017, 2019c]. Annual and Southwest Monsoon season rainfall of India presented 60-year cycle [Figure 7a] – 30 years below the average part and the next 30 years above the average part in majority of the years. This was also evident in tree rings in Brahmaputra River catchment area, more particularly drought or below average part of 60-year cycle. Reddy (2019d): Flood proneness in river flows in Chenab, Ravi & Beas in northwest India also followed this pattern [Reddy, 2016]. The water flows in Godavari River in South India followed this pattern [Figure 7c].
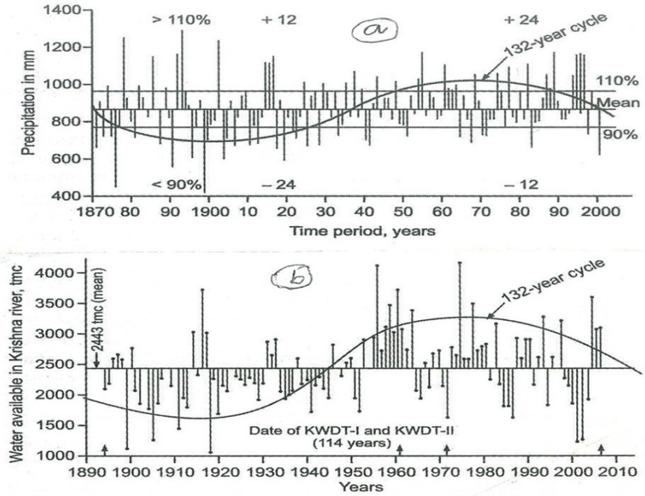
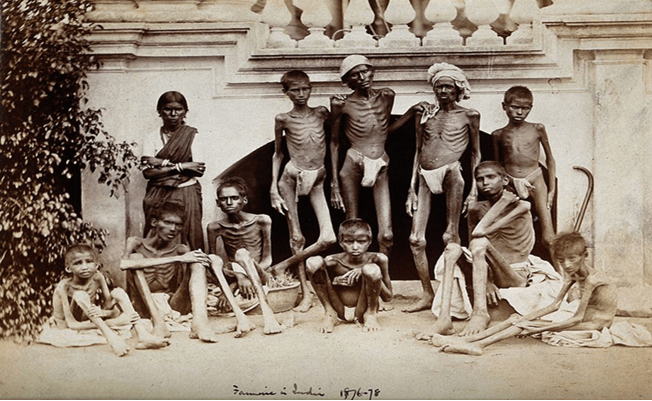
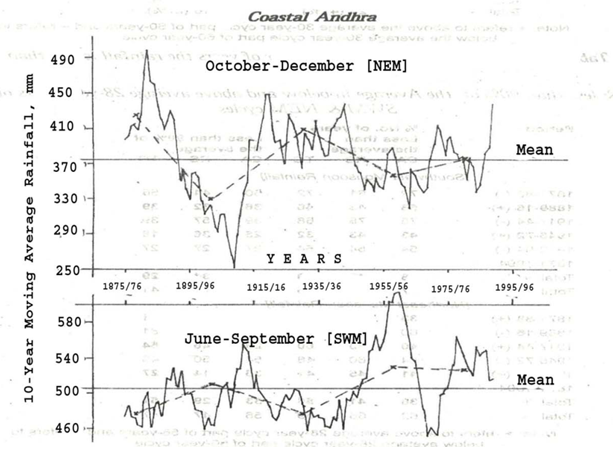
State level (Reddy, 2021c): In the southern India that receives rainfall in both southwest and northeast monsoon seasons, annual rainfall presented 132 year cycle [Figure 12a] with 56–years cycle in both the monsoon seasons [Figure 12b] but they presented opposite phases. Cyclones in Bay of Bengal presented 56 years cycle similar to southwest monsoon rainfall part. Figure 12c presents drought condition in Bangalore during 1676-78. Figure 12a also shows the river flows in Krishna River along with 132 cyclic pattern.

Figure 12c: Rainfall march of Costal Andhra for southwest and northeast monsoon seasons along with 56 year cycle.
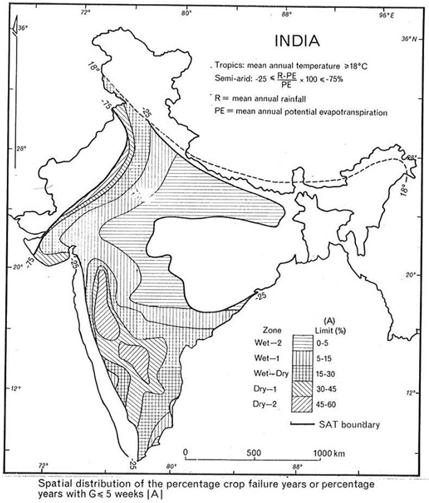
Station level [Reddy, 1993]: For Kurnool in Andhra Pradesh in India the drought proneness is on an average 50% of the years. However the above and below the average 28 years [56 years cycle] they are 70% years and 30% of the years., which has significant impact on Agriculture and water resources availability British Memoires presented severe drought in Bangalore during 1876-78. Figure 13 presents drought proneness in India [varied between 5 and 60% of the years] also presented for Mozambique & Ethiopia. Williams, et al., (1985) discussed for Australia.
Gupta & Reddy (1999): The truncated part of the natural variability data gives misleading inferences. This is what happening very often as they got few years data series.
Summary and Conclusions
- The major deficiency in climate studies is using weather events as climate change on the one hand and using climate change as fictitious global warming on the other hand
- Human induced carbon dioxide is around 96% in the atmosphere and the rest constitutes greenhouse gases. Some groups differentiated between the two types of carbon dioxide and say the greenhouse component is the principal component that is behind global warming a fictitious index
- Some are arguing by putting sunshade in the orbit can bring down incoming solar radiation from the Sun – another type is through cooling glass effect that reflects the 99% incoming solar radiation. These have several ramification/negative impacts on nature, primarily the weather that includes rainfall, water resources, global solar radiation emitted by the Sun, Net Radiation emitted by the Earth, atmospheric water vapour, etc. Also affect ozone in the stratosphere and agriculture & water resources on the Earth. Climate system is the major component affected. These issues are discussed
- Majority of reports use the word climate change for weather related issues with few exceptions. Reports must use the word global warming and stop using climate change to surrogate global warming that leads to misleading interpretation and also need to stop using climate change for weather
- Mitigation applies to “fictitious” global warming. However, so far scientific community has not established a quantitative relationship between greenhouse gases and temperature. Adaptation applies to natural variability in climate change. Though under mitigation, it can be done through land use and land cover part. However, there is little chance with unabated population growth.
- The study of truncated data series that is part of natural variability gives misleading information. For example scientists prepared a report saying that Indian rainfall is decreasing. This information was submitted to Indian Parliament. Here what the scientists did was decreasing hand of sine curve was used; and if they would have used the increasing hand of sine curve they would have come up with statement that “Indian rainfall is increasing.”
- Rainfall and temperature showed cyclic pattern. This will help mitigation.
Acknowledgements
The research is self-financed. The author expresses his grateful thanks to those authors whose work was used for the continuity of the story. The author also confirms there is no conflict of interest involve with any parties in this research study.
The research is self-financed. The author expresses his grateful thanks to those authors whose work was used for the continuity of the story. The author also confirms there is no conflict of interest involve with any parties in this research study.
References
- Akumanchi, et al., (2009). Agro-climatic zonation of Maharashtra state using GIS. Trans Inst. Indian Geogr. 31(1).
- BRS (British Royal Society) & USNAS (United States National Academy of Sciences), (2014). Climate change-evidence and causes.
- De, U.S., Dube, R.K. & Rao, G.S.P., (2005). Extreme weather events over India in the last 100 years. J. Indian Geophys Union, 9(3): 173–187.
- Gupta, R.K., &, Reddy, S.J., (eds.), (1999). Advanced technologies in meteorology. Tata McGraw-Hills, Publ. Comp. Ltd., New Delhi, India, 549.
- Reddy, S.J. &, Rao, K.R., (1973). An empirical method for estimation of evaporation from the free surface of water. India J. Met. Geophys., 24: 137–152.
- Reddy, S.J., (1974). An empirical method for estimating sunshine from total cloud amount. Solar Energy, 15: 281-285.
- Reddy, S.J., (1976) Simple formula for the estimation of wet bulb temperature and precipitable water. Indian J. Meteorol. Hydrol. Geophys. 27: 163–166.
- Reddy, S.J., (1977). Forecasting the onset of southwest monsoon over Kerala. Indian J. Meteorol. Hydrol. Geophys. 28: 113–114.
- Reddy, S.J, Juneja, O.A. & Lahori, S.N., (1977) Power spectral analysis of total & net radiation intensities. Indian J Radio Space Phys, 6: 60–66.
- Reddy, S.J. &, Rao, G.S.P., (1978). A method of forecasting the weather associated with western disturbances. Indian J Meteorol Hydrol Geophy, 29: 515–520.
- Reddy, S.J., (1983a). A simple method of estimating the soil water balance. Agri. Meteorol. 28: 1-17.
- Reddy, S.J. (1983b). Agroclimatic classification of the semi-arid tropics: I & II. Agric Meteorol. 30: 185–200 & 201–219.
- Reddy, S.J., (1984a). Agroclimatic classification of the semi-arid tropics: III & IV. Agric Meteorol, 30: 269–292 & 293–325.
- Reddy, S.J., (1984b). Climatic fluctuations and homogenization of northeast Brazil using precipitation data. Pesq Agropec Bras (Brasilia), 19: 529–543.
- Reddy, S.J, Maite, R.K. &, Seetharama, N., (1984). An iterative regression approach for prediction of sorghum (sorghum bicolar) phenology in the semi-arid tropics. Agric. For. Meteorol. 32: 323–338
- Reddy, S.J., (1985). An agroclimatic classification of the semi-arid tropics: an agroclimatic approach for the transfer of dry-land agricultural technology. PhD (Thesis), 260p [ANU, Library/Canberra]
- Reddy, S.J., (1986). Climatic fluctuations in the precipitation data of Mozambique during the period of meteorological record. Comm. No. 39, Series Terra e Agua, INIA, Maputo, Mozambique, 40p.
- Reddy, S.J. &, Timberlake, J.R., (1987). A simple method for the estimation of primary pasture productivity over Mozambique. Agric. For. Meteorol. 39: 335–349
- Reddy, S.J., (1987). The estimation of global solar radiation and evaporation through precipitation– a note. Solar Energy. 38(2): 97–104.
- Reddy, S.J., (1993). Agroclimatic/agrometeorological techniques: as applicable to dry-land agriculture in developing countries, www.scribd.com/Google Books, 205p; Book review appeared in agricultural and forest meteorology, 67: 325–327.
- Reddy, S.J., (1995a). Comment: sensitivity of some potential evapotranspiration estimation methods to climate change. Agric. For. Meteorol. 77: 121–125
- Reddy, S.J., (1995b). Discussion: over-emphasis in energy terms in crop yield models. Agric. For. Meteorol., 77: 113–120
- Reddy, S.J., (2000). Andhra Pradesh agriculture: scenario of the last four decades, Hyderabad, India, 104p.
- Reddy, S.J., (2002a). Impact of Climate Change on Climate and Water Resources and Thus. 153.
- Reddy, S.J., (2002b). Dry-land agriculture in India: an agro-climatological and agrometeorological perspective. BS Public, Hyderabad, 429.
- Reddy, S.J., (2004). Rainfall prediction for agriculture: past, present & future. Presented at international conference on “Agricultural Heritage of Asia”, Organized by Asian agri-history foundation, held on 6–8 December, 2004, Rajendranagar, Hyderabad, pp 147–154.
- Reddy, S.J., (2007). Agriculture & environment–few thoughts–. Hyderabad, 112.
- Reddy, S.J., (2008). Climate change: myths & realities, www.scribd.com/Google Books, 176.
- Reddy, S.J., (2016). Irrigation and irrigation projects in India: Tribunals, disputes and water wars perspective. BS Public, Hyderabad, India, 132.
- Reddy, S.J’, (2017). Climate change and its impacts: ground realities. BS Public, Hyderabad, India, p 276.
- Reddy, S.J., (2019a). Urban Flooding [The Role of Urbanization & Climate Change]. Pcoc. Nat. Conf., Water, Environment & Society, JNTUH, Hyderabad, India, 3-21.
- Reddy, S.J., (2019b). Agroclimatic/agrometeorological techniques: as applicable to dry-land agriculture in developing countries, 2nd ed. Brillion Publishing, New Delhi, 372.
- Reddy, S.J., (2019c). Workable “Green” green revolution: a framework [Agriculture in the perspective of Climate Change]. Brillion Publishing, New Delhi, p 221.
- Reddy, S.J., (2019d). Water resources availability over India. Brillion Publishing, New Delhi, p 224.
- Reddy, S.J., (2020a). Agro-meteorology: an answer to climate crisis. Brillion Public, New Delhi, p 242.
- Reddy, S.J., (2020b). Indian temperature scenario: “No Global Warming Trend.” Op Acc J Bio Sci Res ,1(1): 6
- Reddy, S.J., (2021a). A note on: “Climate Change/Global Warming versus Climate Crisis. J Agric Aquac, 3(1): 23.
- Reddy, S. J., (2021b). Disturbances recorded in Bay of Bengal & Arabian Sea; A Note. J. Agric. & Aquac., 3 (2): 14.
- Reddy, S.J., (2021c). Is agriculture scape goat in Indian Political Scenario? J. Agric. Sci. & Crop Res., 2(1): 19.
- Reddy, S.J., (2021d). World environment day [WED]–2021: a note. Aditum J Clin Biomed Res, 2(5): 7.
- Reddy, S.J., (2021e). Assessment of Pros & Cons of three Agri Bills 2020 of India. Aditum J Clin Biomed Res, 1(2): 15.
- Reddy, S.J., (2022). A note on “Coldwaves & Heatwaves”: Disturbances [Part-II]. J. Agric. Aqua., 4(1): 20.
- WMO [World Meteorological Organization], (1966). Climate change. Geneva, Switzerland, WMO Tech Note 79, WMO, 195 TP 100, pp 81, (Prepared by Mitchel JM, Dzerdzeevskii B, lohn H, Hofmeyer WL, Lamb HH, Rao KN, Wallen CC)
- Williams, J., Day, K.J., Isbel. R.F., & Reddy, S.J., (1985). Soils and climate. In: Muchou RC (ed) Agroresearch for the semi-arid tropics: Northwest Australia, University of Queensland Press, St. Luis, Brisbane, 31–91.
Citation: Dr. Sazzala Jeevananda Reddy. (2024). Mitigation and Adaptation strategies for Global Warming & Climate Change. Journal of Agriculture and Aquaculture 6(1).
Copyright: © 2024 Sazzala Jeevananda Reddy. This is an open-access article distributed under the terms of the Creative Commons Attribution License, which permits unrestricted use, distribution, and reproduction in any medium, provided the original author and source are credited.

