Research Article
Volume 4 Issue 3 - 2022
Statistical Analysis of Land Surface Temperature and Normalized Difference Vegetation Index Relationship Based on Remote Sensing
Institute of water resources Engineering and Management, Mehran University of Engineering and technology, Jamshoro
*Corresponding Author: Shoukat Ali Shah, Institute of water resources Engineering and Management, Mehran University of Engineering and technology, Jamshoro.
Received: March 19, 2022; Published: August 15, 2022
Abstract
This study analysis and explore the relationship between land surface temperature (LST) and normalized difference vegetation index (NDVI) over Dadu district from 2013-2020. Landsat 8 imageries of 2013-2020 were availed from the USGS web portal. To retrieve the LST and to examine the correlation between LST & NDVI, the red, NIR, and thermal bands were used in ArcGIS 10.8 software. Maximum and Minimum LST of 2013-2020 were computed as 6°C to 46°C and 17°C to 43°C respectively. On the other hand, NDVI values of 2013 were determined as 0.601 to -0.29, and values of 2020 were computed as 0.547 and -0.260 over the study area. Comparing NDVI of 2013-2020, the vegetation canopy is highest in 2013 with full greenery on the agricultural land. There was a linear and negative correlation was detected in 2013(R2=0.337) and 2020(R2=0.2361) between LST & NDVI. It is concluded that increasing LST highly affects vegetation cover. Therefore, current work ensures that the surface temperature and land cover observation datasets from Landsat images provide precise and timely information. It is quite effective for determining the relationship among LULC, LST, NDVI, NDWI, moisture index, drought index for current and future scenarios on densely urban, regional, and at the global level.
Introduction
Geographic information systems and remote sensing are powerful and cost-effective tools for assessing the Spatio-temporal changes in land use-cover dynamics Seera et al., (2008), as well as assessment of environmental parameters. The abilities of geospatial sciences have achieved ranked higher and considerable credibility over the last few decades. It analyses Landsat images to examine temporal land cover changes (Cohen, 1960). Remote sensing tools have been extensively applied to assess land cover changes through time and to assess patterns of changes, to integrate environmental with social change, and to identify the risk of environmental deterioration (Hayes and Sader 2001).
LST plays a significant role in the earth’s surface and atmosphere relationship. It is an important parameter in all physical processes of surface energy and water balance on a global scale (Karnieli, et al., 2010). Not only a role in the land surface process but also has climatic importance because it is in control of the sensible and latent heat flux exchange (Sun and Pinker 2003). The application of LST in many fields i.e., climate change, vegetation monitoring, hydrological cycle, urban climate, and environmental studies (Kalma, et al., 2008). LST is used in models of vegetation stress and assessed for developing climatic trends. Due to the limitations in the situ data and observations and relatively large spatial variability in surface temperature. It can be measured with satellite retrievals. Satellite imageries deliver Spatio-temporal information for surface temperature trends, variability and are continuously used by the researchers to evaluate changes in the environment particularly in urban and vegetative zones. Recently, scientists have admitted that land use cover conjured by human interactions has massive influences on the regional and global climate. Several studies have revealed that expansion in settlements/built-up will cause drastic changes in temperature, clouds, rainfall, and wind. In this study, the target was to assess and explore the correlation between LST & NDVI from 2013-2020 over the Dadu district. For this, the author has used such imageries of a season that can get all the results of vegetation and surface temperature clear. The surface temperature on each class like waterbody, settlements, built-up areas, vegetation, mountains, and on the barren land area has been assessed and also recognized the potential impacts on these classes.
Materials and Methods
Study Area
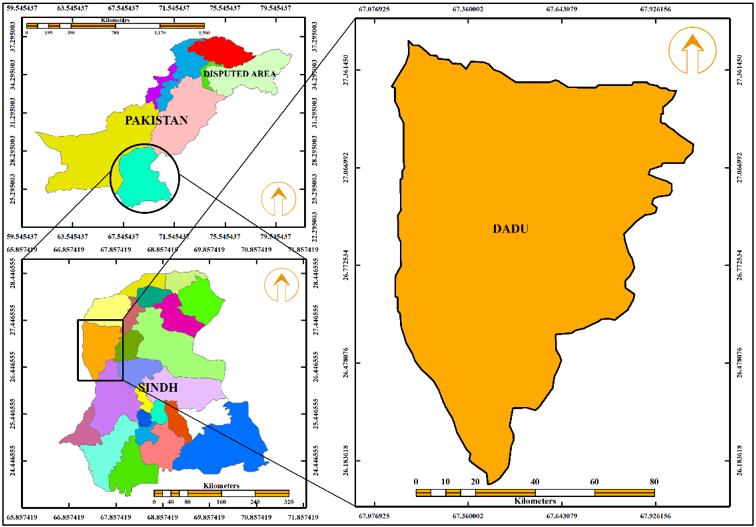
Dadu district (26° 06’ 35” to 27° 26’ 20” north latitude and 67° 07’ to 68o 02’ 17” east longitude) situated in the west of Sindh. The district is bordered on the North of Kamber Shadadkot, on the East Larkana district, and Shaheed Benazeerabad district, on the West Kirthar mountains and Baluchistan and the South Jamshoro district (Figure. 1). The total geographical area of Dadu is 8035 km2 (4992.096 miles). The district comprises 4 talukas viz.; Dadu, Mehar, Khairpur Nathan Shah, and Johi. Dadu is intensively hot in summer and cold in winter. The temperature of the district, in summer is recorded between 17°C to 46°C. Annual rainfall in the district has been noted at about 120mm. The peoples of the Dadu district mainly depend on agriculture. Kharif and Rabi seasons are the two main seasons for crops sowing to harvesting. April-May starting, and October-November end of the Kharif period. Whereas, the Rabi period starts from November-December and ends in April-May. Crop patterns, sowing, and harvesting time are different due to regional variation of temperature, soil texture, varieties, and availability of irrigation water, etc. Agriculture is categorized as major-minor crops. Wheat, cotton, rice, sugarcane are the major crops, and barely, jowar, gram, and mustard fall in minor crops. Agricultural land is irrigated by canal water and by tube wells. Sukkur barrage supplies irrigation water via Rice and Dadu canal, some portion of land is irrigated through Kotri barrage. Tube wells also irrigate the crops.
Dadu district (26° 06’ 35” to 27° 26’ 20” north latitude and 67° 07’ to 68o 02’ 17” east longitude) situated in the west of Sindh. The district is bordered on the North of Kamber Shadadkot, on the East Larkana district, and Shaheed Benazeerabad district, on the West Kirthar mountains and Baluchistan and the South Jamshoro district (Figure. 1). The total geographical area of Dadu is 8035 km2 (4992.096 miles). The district comprises 4 talukas viz.; Dadu, Mehar, Khairpur Nathan Shah, and Johi. Dadu is intensively hot in summer and cold in winter. The temperature of the district, in summer is recorded between 17°C to 46°C. Annual rainfall in the district has been noted at about 120mm. The peoples of the Dadu district mainly depend on agriculture. Kharif and Rabi seasons are the two main seasons for crops sowing to harvesting. April-May starting, and October-November end of the Kharif period. Whereas, the Rabi period starts from November-December and ends in April-May. Crop patterns, sowing, and harvesting time are different due to regional variation of temperature, soil texture, varieties, and availability of irrigation water, etc. Agriculture is categorized as major-minor crops. Wheat, cotton, rice, sugarcane are the major crops, and barely, jowar, gram, and mustard fall in minor crops. Agricultural land is irrigated by canal water and by tube wells. Sukkur barrage supplies irrigation water via Rice and Dadu canal, some portion of land is irrigated through Kotri barrage. Tube wells also irrigate the crops.
Data acquisition and tools used.
Earth observation satellite data were attained from the Landsat series covering the study area. USGS-GloVIS (https://earthexplorer.usgs.gov/) web portal was used for satellite data. Two years' imageries were downloaded from Landsat 8 OLI/TIRS in Tagged Image File (TIF) format with 0% cloud cover. Satellite images were referenced to the (UTM) Universal Transverse Mercator projection system and covered three scenes of Landsat 8 imageries from the worldwide reference system (WRS-2) of (path 152 row 41, path 152 row 42, and path 153 row 41).
Earth observation satellite data were attained from the Landsat series covering the study area. USGS-GloVIS (https://earthexplorer.usgs.gov/) web portal was used for satellite data. Two years' imageries were downloaded from Landsat 8 OLI/TIRS in Tagged Image File (TIF) format with 0% cloud cover. Satellite images were referenced to the (UTM) Universal Transverse Mercator projection system and covered three scenes of Landsat 8 imageries from the worldwide reference system (WRS-2) of (path 152 row 41, path 152 row 42, and path 153 row 41).
Computation of NDVI
NDVI is one of the most commonly used vegetation indices in remote sensing. With the improved accessibility of remotely sensed data from satellites and UAVs, researchers and scientists have come to implement vegetation index in their research activity. NDVI indicates biomass and greenness Chen and Brutsaert (1998). It is used as a standard for comparing vegetation greenness between satellite images LU and WENG (2007). The value ranges of NDVI from +1 to -1. Positive values show a vegetated area and negative values indicate a non-vegetative area. In this study, NDVI has been calculated for both the images 2013-2020 to check how much greenness is in the area of study. The following (Equation. 1) is used for NDVI calculation.
NDVI is one of the most commonly used vegetation indices in remote sensing. With the improved accessibility of remotely sensed data from satellites and UAVs, researchers and scientists have come to implement vegetation index in their research activity. NDVI indicates biomass and greenness Chen and Brutsaert (1998). It is used as a standard for comparing vegetation greenness between satellite images LU and WENG (2007). The value ranges of NDVI from +1 to -1. Positive values show a vegetated area and negative values indicate a non-vegetative area. In this study, NDVI has been calculated for both the images 2013-2020 to check how much greenness is in the area of study. The following (Equation. 1) is used for NDVI calculation.
NDVI = NIR(band 5)-Red(band 4)
NIR(band 5)+Red(band 4) (1)
NIR(band 5)+Red(band 4) (1)
Land Surface Temperature (LST) retrieval
LST is the temperature at the interface of the earth’s surface with its atmosphere. It can be determined from the ground surface up to the height of 2-3 meters. Whereas, estimating of LST from Landsat 8 data, spectral band 10 particularly thermal band, in ArcGIS raster processing involving the following steps:
LST is the temperature at the interface of the earth’s surface with its atmosphere. It can be determined from the ground surface up to the height of 2-3 meters. Whereas, estimating of LST from Landsat 8 data, spectral band 10 particularly thermal band, in ArcGIS raster processing involving the following steps:
Conversion of Satellite Digital Number into Radiance
The equation below indicates the radiance rescaling factor, a thermal infrared digital number was converted into radiance using the equation.
Lλ = ML × Qcal + AL - Oi (2)
The equation below indicates the radiance rescaling factor, a thermal infrared digital number was converted into radiance using the equation.
Lλ = ML × Qcal + AL - Oi (2)
Where, Lλ = TOA spectral radiance (Watts/ (m2 * sr * μm)), ML = Radiance multiplicative band (No.10), AL = Radiance adds band 10, Qcal= Quantized and calibrated standard product pixels values (DN), Oi= Correlation value for band 10 is 0.29.
Conversion of Radiance to AT-Sensor temperature
Spectral radiance data can be converted to the TOA to BT using thermal constant values in the metadata file.
Spectral radiance data can be converted to the TOA to BT using thermal constant values in the metadata file.
Where, BT= Top of atmosphere brightness temperature (°C), Lλ = TOA spectral radiance (Watts/ (m2 * sr * μm)), K1 and K2 stand for the band-specific thermal conversion constants from the metadata. To achieve the results in Celsius, the radiant temperature is revised by adding the absolute zero (-273.15°C).
Calculating Land Surface Emissivity (LSE)
LSE is the average emissivity of an element of the surface of the earth determined from NDVI values.
LSE is the average emissivity of an element of the surface of the earth determined from NDVI values.
Where, PV=Proportion of vegetation, NDVI= DN values from NDVI image, NDVI min=Minimum DN values from NDVI image, NDVI max=Maximum DN values from NDVI image.
E = 0.004PV + 0.986 (5)
E = 0.004PV + 0.986 (5)
Here, E = Land surface Emissivity, and 0.986 corresponds to a correction value of the equation.
Conversion of Satellite Brightness Temperature into LST
LST is the relative temperature estimated using BT, a wavelength of emitted radiance, LSE.
LST is the relative temperature estimated using BT, a wavelength of emitted radiance, LSE.
Here, C2=14388 µm K, the value of λ for Landsat 8: For Band 10 is 10.8. λ = Wavelength of emitted radiance, C2= h*c/s=1.4388*10-2 mK =14388 mK, h=Planck’s constant = 6.626*10-34 J s, s= Boltzmann constant = 1.38*10-23 JK, c = velocity of light = 2.998*108 m/s.
Results
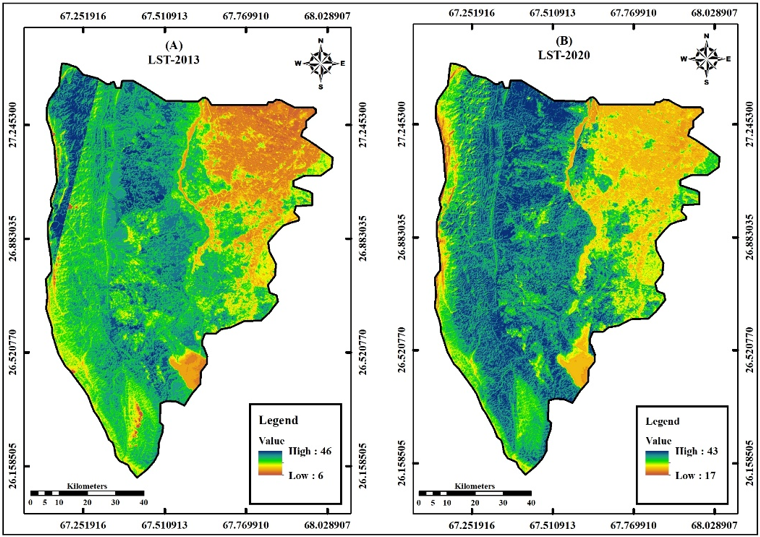
The estimated results of LST indicated in 2013 imagery, minimum, and maximum LST 6°C and 46°C were observed (Figure.2A). It displayed 40°C differences in temperature. The lowest temperature was recorded on vegetation and water body areas about 21°C to 27°C. While, the highest temperature was noted on settlements/built-up, barren land and mountain areas as 34°C and 46°C. On the other hand, 2020 imagery (Figure 2B) showed the minimum and maximum LST were 17°C and 43°C respectively with a mean of 4°C. LST observed on vegetation cover and water body was 17°C to 27°C. The temperature seems on barren land and settlements as 37°C to 43°C. In eight years, 2013-2020, the minimum temperature was increased 11°C and the maximum temperature decreased about 3°C.
Landsat 8 imagery of 2020 indicated that the maximum temperature has decreased by about 3°C. It has been concluded from analysis and interpretation of LST, a recent COVID-19 situation, and excess rainfall impacted the LST of the study area. Many countries are affected badly due to a recent pandemic COVID-19. In the long run, a lockdown situation has been imposed worldwide. There were no human activities including constructions, migration, settlements. Secondly, the year was passed in heavy rainfall in the region and country. The emissions were less, decreasing in pollution from factories, automobiles, vehicles, etc. Hence, LST was decreased. These two reasons restored the environment and ecology in the study area as well as the country.
Computation of NDVI 2013-2020
NDVI is broadly implemented for mapping and monitoring the vegetative zones using remote sensing data Shah and Siyal (2019). NDVI calculation gives a range from -1 to 1. Negative values indicate the area with the water surface, buildings, and structures, rocks, clouds, barren land typically falls within the 0.1-0.2 range. Plants have positive values between 0.2 to 1. A dense vegetation canopy should be above 0.5 and sparse vegetation falls within 0.2 to 0.5. Moderate vegetation between 0.4 to 0.6, above 0.6 specifies the highest density of green leaves Shah and Kiran (2021).
NDVI is broadly implemented for mapping and monitoring the vegetative zones using remote sensing data Shah and Siyal (2019). NDVI calculation gives a range from -1 to 1. Negative values indicate the area with the water surface, buildings, and structures, rocks, clouds, barren land typically falls within the 0.1-0.2 range. Plants have positive values between 0.2 to 1. A dense vegetation canopy should be above 0.5 and sparse vegetation falls within 0.2 to 0.5. Moderate vegetation between 0.4 to 0.6, above 0.6 specifies the highest density of green leaves Shah and Kiran (2021).
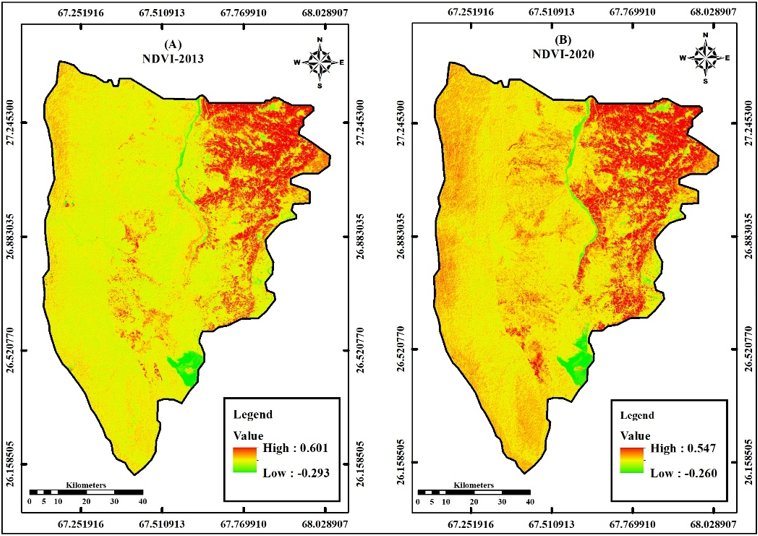
NDVI values of 2013 imagery (Figure.3A) were determined 0.601 to -0.29. The maximum values indicate the vegetation canopy over an area is highest, and the minimum values are displayed on the water body and barren land areas. While the NDVI of 2020 imagery shows that the maximum value of 0.547 and observed as healthy vegetation, and the minimum value is -0.260 over the study area. Comparing NDVI of 2013-2020, the vegetation canopy is highest in 2013 with full greenery on the agricultural land.
Correlation between LST-NDVI 2013-2020
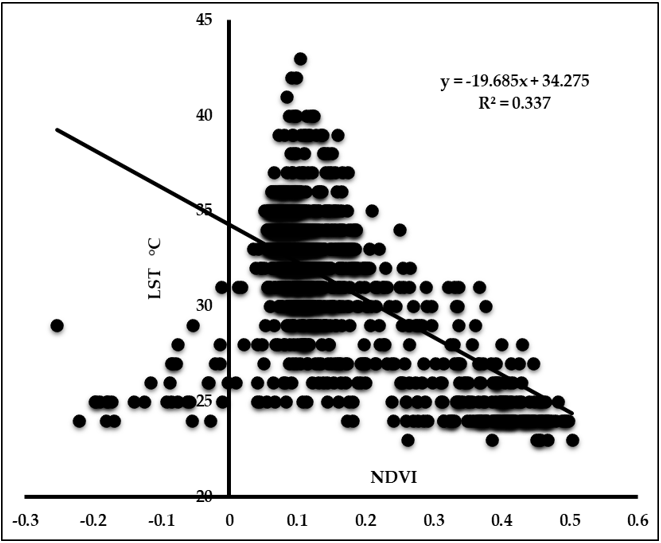
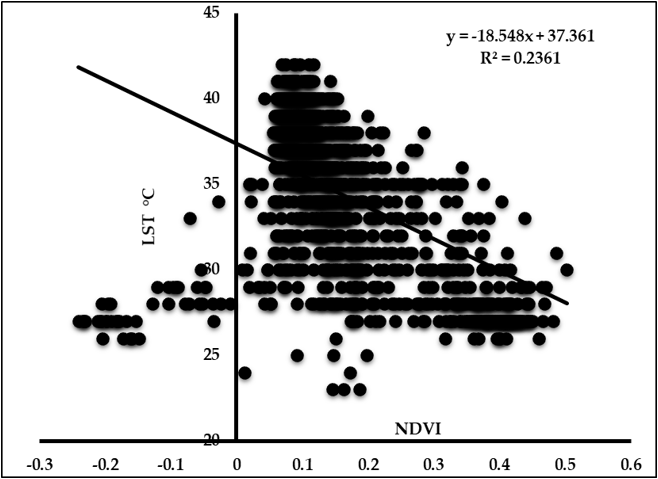
In (Figure. 4), the 2013 imagery shows a negative correlation between NDVI & LST. This means that the higher the NDVI, the lower the LST and vice versa. Similarly, 2020 imagery (Figure. 5) also depicted that the NDVI and LST have a linear and negative correlation. The correlation values between LST and NDVI in both imageries are 2013R2=0.337 and 2020R2=0.2361. The correlation gives a clear indication there was a linear and strong negative correlation. Hence, less vegetative areas experienced as high LST, and full greenery areas, agricultural land, waterbody have high NDVI.
In (Figure. 4), the 2013 imagery shows a negative correlation between NDVI & LST. This means that the higher the NDVI, the lower the LST and vice versa. Similarly, 2020 imagery (Figure. 5) also depicted that the NDVI and LST have a linear and negative correlation. The correlation values between LST and NDVI in both imageries are 2013R2=0.337 and 2020R2=0.2361. The correlation gives a clear indication there was a linear and strong negative correlation. Hence, less vegetative areas experienced as high LST, and full greenery areas, agricultural land, waterbody have high NDVI.
Discussion
The negative relationship between NDVI and LST was observed for all LULC categories. This study also delivers a recent outlook for correlation between NDVI & LST over the district that took place from 2013-2020.
- The NDVI range is -0.29 to 0.60 in 2013 and -0.26 to 0.54 in 2020. The lowest values refer to the sub-urban, mountain, and barren land of Dadu district. In contrast, the highest values refer to the vegetation cover, agricultural land where the vegetation and greenery are the densest.
- LST of Dadu from 2013-2020 indicates the highest temperature exists at the mountain, barren land, and settlements areas. Whereas, the lowest temperature exists at vegetation areas such as crops, grass, and the waterbody.
- The correlation between LST and NDVI and regression coefficient from NDVI to LST are negative, which means that where NDVI is lower has higher LST and where NDVI is higher has lower LST.
Conclusion
The research study is based on assessment and explores the relationship between NDVI & LST from 2013-2020 over the Dadu district. This study clearly shows that the increasing population, development in urban areas, and land-use practices are the main drivers for rising the LST and local environment. Another factor of increasing LST is barren land and mountains due to topographic factors such as slope, height, elevation. Moreover, the surface temperature is continuously rising day by day, while the vegetation index peak is quite noticeable, especially in agricultural land and water body areas. Increasing LST highly affects vegetation cover. Therefore, current work ensures that the land surface observation datasets from RS images provide precise and timely information on the effects of land-use cover, vegetation, urbanization, non-vegetative areas, and the topography of the area.
References
- Serra, P.; Pons, X.; Sauri, D. (2008). Land cover and land-use change in Mediterranean landscapes: A spatial; analysis of driving forces integrating biophysical and human factors. Appl. Geog. 28 (3): 189-209.
- Cohen, J. (1960). A coefficient of agreement for nominal scales. Edu. Psychol. Meas.20: 37-46.
- Hayes, D.J.; Sader, S.A. (2001). Comparison of change-detection techniques for monitoring tropical forest clearing and vegetation regrowth in a time series. Photogramm. Eng. Rem. S. 67 (9): 1067-1075.
- Karnieli, A.; Agam, N.; Pinker, R. T.; Anderson, M.; Imhoff, M. L.; Gutman, G. G. (2010). Use of NDVI and land surface temperature for drought assessment: Merits and Limitations. J. Clim.23: 618-633.
- Sun, D.; Pinker, R. T. (2003). Estimation of land surface temperature from a Geostationary Operational Environmental Satellite (GOES-8). J. Geophy. Res.108, pp. 26-43.
- Kalma, J. D.; Mc Yicar, T. R.; Mc Cabe, M. F. (2008). Estimating land surface evaporation: A review of methods using remotely sensed surface temperature data. Survey in Geophy.29, pp-421-469.
- Chen, D.; Brutsaert, W. (1998). Satellite-sensed distribution and spatial patterns of vegetation parameters over a tallgrass prairie. J. Atmos. Sci.55 (7): 1225-1238.
- Lu, D.; Weng, Q. (2007). A survey of image classification methods and techniques for improving classification performance. Int. J. Remote Sens. 28 (5).
- Shah, S.A.; Siyal, A.A. (2019). GIS-based approach estimation of area under wheat and other major rabi crops in district Ghotki and corresponding irrigation water requirement. ACTA Sci. Agric.3 (12): 59-70.
- Shah, S. A.; Kiran, M. (2021). A GIS-based technical analysis of land use and land cover change detection in taluka Mirpur Mathelo: A case study in district Ghotki, Pakistan. Int. Adv. Res. Eng. J. 5 (2): 231-239.
Citation: Shoukat Ali Shah. (2022). Statistical Analysis of Land Surface Temperature and Normalized Difference Vegetation Index Relationship Based on Remote Sensing. Journal of Agriculture and Aquaculture 4(3).
Copyright: © 2022 Shoukat Ali Shah. This is an open-access article distributed under the terms of the Creative Commons Attribution License, which permits unrestricted use, distribution, and reproduction in any medium, provided the original author and source are credited.

