Research Article
Volume 1 Issue 1 - 2018
Treatment for Colorectal Cancer: Ursolic Acid Loaded Poly (Lactic-Co-Glycolic Acid) Nanoparticles and Caffiene Loaded Poly (Lactic-Co-Glycolic Acid) Nanoparticles
1Department of Biochemistry, Muslim Arts College, Thiruvithancode, Tamilnadu, India
2Department of Biochemistry & Biotechnology, Annamalai University, Annamalainagar. Tamilnadu, India
2Department of Biochemistry & Biotechnology, Annamalai University, Annamalainagar. Tamilnadu, India
*Corresponding Author: JP Jose Merlin, Department of Biochemistry, Muslim Arts College, Thiruvithancode, Tamilnadu, India.
Received: December 13, 2018; Published: December 28, 2018
Abstract
Cancer is one of the leading causes of adult deaths worldwide. The aim of the present study was to develop UA-PLGA NPs and Caf-PLGA NPs to study its anticancer efficacy in colorectal cells in vitro. Synthesis the nanoparticles, Particle size, size distribution and zeta potential, Drug encapsulation efficiency and in vitro drug release are the method used for this study. In vitro studies was subjected in cancer cell lines and the parameters used were Drug treatment and dose fixation study, Apoptotic morphological changes. The results demonstrated the increased level of anticancer property of UA-PLGA NPs and Caf-PLGA NPs in cancer cells.
Keywords: Nanoparticles; Anticancer; Ursolic acid (UA); Caffeine (Caf); Poly lactic-co-glycolic acid (PLGA)
Introduction
Colorectal cancer (CRC) is a formidable health problem worldwide. It is the third most common cancer in men (663000 cases, 10.0% of all cancer cases) and the second most common in women (571000 cases, 9.4% of all cancer cases) [1]. Almost 60% of cases are encountered in developed countries. The number of CRC-related deaths is estimated to be approximately 608000 worldwide, accounting for 8% of all cancer deaths and making CRC the fourth most common cause of death due to cancer [2].
Chemotherapy involves the distribution of cancer-killing chemicals throughout a patient’s body via a vein, or in a pill form by mouth, to destroy fast-growing cancer cells that may be lingering after surgery. Chemotherapy can also be used to shrink a rectal tumour before surgery, and treat advanced (Stage IV) disease [3]. Chemotherapy is the use of medicines or drugs to treat a disease, such as cancer. Many times this treatment is just called chemo. Surgery and radiation therapy remove, kill, or damage cancer cells in a certain area, but chemo can work throughout the whole body.
Chemotherapy, a major treatment for cancer patients primary for leukemia’s and inoperable solid tumors, adjuvant and neo adjuvant for operable solid tumors often fails the patients due to inherent or acquired multidrug resistance (MDR) [4].
Nanotechnology has led to the development of drug delivery systems to achieve the targeted transport of anticancer drugs [5]. Incorporation of anticancer drugs into the nanoparticles, reduces the adverse reactions and increases the therapeutic efficacy due to changes in the pharmacokinetics or tissue distribution [6]. Nanoparticles may be delivered to specific sites by size dependant passive targeting or by active targeting [7,8].
Poly (lactic-co-glycolic acid) (PLGA) is one of the most successfully used biodegradable polymers because its hydrolysis leads to metabolite monomers, lactic acid and glycolic acid. Because these two monomers are endogenous and easily metabolized by the body via the Krebs cycle, a minimal systemic toxicity is associated with the use of PLGA for drug delivery or biomaterial applications [9].
Ursolic acid, a pentacyclic triterpenoid carboxylic acid found in plants, has various biological properties, including anti-inflammatory, anticancer, anti-angiogenic, and antioxidative activities [10,11]. UA has antifungal [12], insecticidal [13], anti-HIV [14], diuretic [15], complement inhibitory [16], blood sugar depression [17] and gastrointestinal transit modulating [18] activities.
Caffeine (1, 3, 7-trimethylxanthine) is found in both coffee and tea, so a great number of people are exposed to various doses of caffeine. It acts as a stimulant for the central nervous, respiratory and cardiac system. Caffeine significantly reduces cancer risk caused by environmental and dietary carcinogens [19] and the protective action of caffeine against a variety of chemical carcinogens was established by several studies, carried out by Abraham [20]. The aim of the present study was to develop UA-PLGA NPs and Caf-PLGA NPs to study its anticancer efficacy in colorectal cells in vitro
Materials and Methods
Chemicals
Poly lactic-co-glycolic acid (PLGA) 65:35 (MW 40,000-75,000), poly vinyl alcohol (PVA) (MW 25,000), Ursolic acid (UA), Caffeine (Caf), thiobarbituric acid (TBA), phenazine methosulphate (PMS), nitroblue tetrazolium (NBT), 5, 5-dithiobis 2-nitrobenzoic acid (DTNB), 3-(4,5-dimethylthiazol-2-yl)-2,5-diphenyl tetrazolium bromide (MTT), ethidium bromide (EtBr), acridine orange (AO), fetal calf serum (FCS), DMEM medium, glutamine- penicillin-streptomycin solution, ficoll-histopaque 1077, trypsin-EDTA were purchased from Sigma Chemicals Co., St. Louis, USA.
Poly lactic-co-glycolic acid (PLGA) 65:35 (MW 40,000-75,000), poly vinyl alcohol (PVA) (MW 25,000), Ursolic acid (UA), Caffeine (Caf), thiobarbituric acid (TBA), phenazine methosulphate (PMS), nitroblue tetrazolium (NBT), 5, 5-dithiobis 2-nitrobenzoic acid (DTNB), 3-(4,5-dimethylthiazol-2-yl)-2,5-diphenyl tetrazolium bromide (MTT), ethidium bromide (EtBr), acridine orange (AO), fetal calf serum (FCS), DMEM medium, glutamine- penicillin-streptomycin solution, ficoll-histopaque 1077, trypsin-EDTA were purchased from Sigma Chemicals Co., St. Louis, USA.
Preparation and characterization nanoparticles
Preparation of drug loaded nanoparticles
UA-PLGA NPs and Caf-PLGA NPs were prepared by nanoprecitation method as previously described by Brown [21].0.1% of PVA was prepared by dissolving 100 mg of PVA in 100 ml distilled water in magnetic stirrer at 60ºC. Organic solution of PLGA (100 mg) and UA/Caf (10 mg) in acetone (10 ml) was added to PVA solution (10 ml). The sample was sonicated at 25 watts for 2 min (Sonics VC-130, Sonics and Materials Inc. CT, USA) and kept the sample under magnetic stirrer at room temperature for 6h. To remove the non-incorporated drug, the obtained nanosuspension was centrifuged and washed with distilled water twice at 14,000 rpm for 30 min. The supernatant containing the free drug was discarded and the pellet was freeze dried at -50ºC.
Particle size, size distribution and zeta potential
DLS (Zetasizer Nano, Malvern Instruments Ltd. United Kingdom) was used to measure the average size and size distribution of the prepared nanoparticles. Three different batches were analyzed to give an average value and standard deviation for the particle diameter and zeta potential.
DLS (Zetasizer Nano, Malvern Instruments Ltd. United Kingdom) was used to measure the average size and size distribution of the prepared nanoparticles. Three different batches were analyzed to give an average value and standard deviation for the particle diameter and zeta potential.
Scanning electron microscopy (SEM)
The morphological features of RSV-GNPs were examined by scanning electron microscopy (Quanta 200F, FEI, Hillsboro, OR, USA). The samples were sprinkled onto a double-sided tape and sputter-coated with a 5 nm thick gold layer. The inner-structure of nanoparticles was observed after fracturing by a razor blade.
The morphological features of RSV-GNPs were examined by scanning electron microscopy (Quanta 200F, FEI, Hillsboro, OR, USA). The samples were sprinkled onto a double-sided tape and sputter-coated with a 5 nm thick gold layer. The inner-structure of nanoparticles was observed after fracturing by a razor blade.
Drug encapsulation efficiency
Drug encapsulation efficiency was described by the method of Mathew, 2010 [22]. UA-PLGA NPs and Caf-PLGA NPs were centrifuged at 14,000 rpm for 30 min. The supernatant containing unencapsulated drug was removed. The samples were washed with deionised water and the pellets obtained were re-suspended in deionised water and freeze dried for 48h to get powdered sample. Three mililitre of the supernatant obtained after centrifugation was taken in a cuvette and the absorbance value was recorded at 266 nm using a UV spectrophotometer.
Drug encapsulation efficiency was described by the method of Mathew, 2010 [22]. UA-PLGA NPs and Caf-PLGA NPs were centrifuged at 14,000 rpm for 30 min. The supernatant containing unencapsulated drug was removed. The samples were washed with deionised water and the pellets obtained were re-suspended in deionised water and freeze dried for 48h to get powdered sample. Three mililitre of the supernatant obtained after centrifugation was taken in a cuvette and the absorbance value was recorded at 266 nm using a UV spectrophotometer.
Encapsulation efficiency (%) = [Drug] tot − [Drug] free/[Drug] tot × 100
In vitro drug release
Drug release profiles of nanoparticles were investigated in PBS and 10% FBS medium at pH 7.4 accordingly by the method of Dong, 2004 [23]. Five microgram of lyophilized UA-PLGA NPs and Caf-PLGA NPs were dispersed in 30 ml of 10% FBS/PBS and placed in water bath shaker set at 37ºC with a shaking speed of 120 rpm. At 1h time intervals 3 ml of supernatant from the sample was taken for analysis and the same amount of fresh 10% FBS/PBS was replaced to the sample. Each time absorbance value at 266 nm was recorded using UV spectrophotometer.
Drug release profiles of nanoparticles were investigated in PBS and 10% FBS medium at pH 7.4 accordingly by the method of Dong, 2004 [23]. Five microgram of lyophilized UA-PLGA NPs and Caf-PLGA NPs were dispersed in 30 ml of 10% FBS/PBS and placed in water bath shaker set at 37ºC with a shaking speed of 120 rpm. At 1h time intervals 3 ml of supernatant from the sample was taken for analysis and the same amount of fresh 10% FBS/PBS was replaced to the sample. Each time absorbance value at 266 nm was recorded using UV spectrophotometer.
| Drug release (%) = | [UA/Caf]rel | x 100 |
| [UA/Caf]tot |
Anticancer efficacy of drug loaded nanoparticles
Cell lines and culture conditions
The present work was carried out in colon cancer cell lines HT29). HT29 cells were obtained from National Centre for Cell Science (NCCS), Pune, India. The present work has been approved by Institutional Ethical Committee (IEC), Annamalai University. The cells were grown as monolayer in DMEM medium supplemented with 10% FCS, 1mM sodium pyruvate, 10 mM HEPES, 1.5 g/L sodium bicarbonate, 2mM L-glutamine, and 100 U/ml penicillin-streptomycin at 37°C in 5% CO2 incubator.
Drug treatment and dose fixation study
Cells were treated with different concentration of UA-PLGA NPs and Caf-PLGA NPs (6.25, 12.5, 25, 50 and 100 µg) and incubated for 24 h at 5 % CO2 incubator. Cytotoxicity was observed by MTT assay by the method of Mosmann, 1983 [24]. IC50 was calculated by (ED50 plus software V 1.0). IC50 values were calculated and the optimum dose was used for further study.
Cells were treated with different concentration of UA-PLGA NPs and Caf-PLGA NPs (6.25, 12.5, 25, 50 and 100 µg) and incubated for 24 h at 5 % CO2 incubator. Cytotoxicity was observed by MTT assay by the method of Mosmann, 1983 [24]. IC50 was calculated by (ED50 plus software V 1.0). IC50 values were calculated and the optimum dose was used for further study.
Experimental groups
The HT29 cells were divided into 4 experimental groups. Group 1: Untreated control cells, Group 2: UA-PLGA NPs treatment alone (88.10 µg), Group 3: Caf-PLGA NPs treatment alone (49.63 µg) and Group 4: UA-PLGA NPs (88.10 µg) + (after one hour) Caf-PLGA NPs (49.63 µg) treatment.
The HT29 cells were divided into 4 experimental groups. Group 1: Untreated control cells, Group 2: UA-PLGA NPs treatment alone (88.10 µg), Group 3: Caf-PLGA NPs treatment alone (49.63 µg) and Group 4: UA-PLGA NPs (88.10 µg) + (after one hour) Caf-PLGA NPs (49.63 µg) treatment.
Apoptotic morphological changes
Apoptotic morphological changes during drug loaded nanoparticles treatment were analyzed by AO/EtBr staining. This dual staining method differentiate condensed chromatin of dead apoptotic cells from the intact normal cell nuclei (Lakshmi, 2008) [25]
Apoptotic morphological changes during drug loaded nanoparticles treatment were analyzed by AO/EtBr staining. This dual staining method differentiate condensed chromatin of dead apoptotic cells from the intact normal cell nuclei (Lakshmi, 2008) [25]
Alkaline single cell gel electrophoresis
DNA damage was estimated by comet assay according to the method of Singh., et al. 1988 [26]. For analysis of the comet images, the extent of DNA damage was estimated by fluorescence microscopy using the digital camera and analyzed the image by Tritek comet scoring software [27]. DNA damage was quantified by the tail moment, tail length and Olive tail moment [28].
DNA damage was estimated by comet assay according to the method of Singh., et al. 1988 [26]. For analysis of the comet images, the extent of DNA damage was estimated by fluorescence microscopy using the digital camera and analyzed the image by Tritek comet scoring software [27]. DNA damage was quantified by the tail moment, tail length and Olive tail moment [28].
Statistical analysis
Statistical analysis was performed by one-way ANOVA followed by DMRT taking p < 0.05 to test the significant difference between groups.
Statistical analysis was performed by one-way ANOVA followed by DMRT taking p < 0.05 to test the significant difference between groups.
Results
Physicochemical characterization of drug loaded nanoparticles
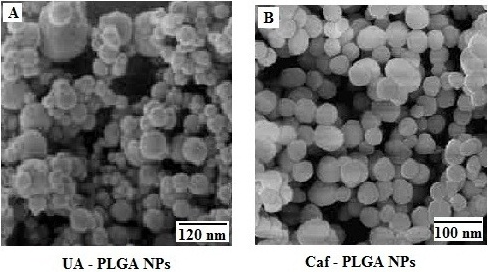
It has been noticed that the prepared UA-PLGA NPs and Caf-PLGA NPs possess average size of 120 nm and 100 nm and polydispersity index (PI) of 0.060 and 0.054 (Figure 1a and b). Further, the prepared UA-PLGA NPs and Caf-PLGA NPs had zeta potential of −24.8 mV and −14.3 mV. It has been found that 69% of UA and 78% of Caf were encapsulated in PLGA NPs (Table 1). SEM images of the UA-PLGA NPs and Caf-PLGA NPs are shown in Figure 2. The prepared UA-PLGA NPs and Caf-PLGA NPs had smooth surface but with some irregular small particles.
It has been noticed that the prepared UA-PLGA NPs and Caf-PLGA NPs possess average size of 120 nm and 100 nm and polydispersity index (PI) of 0.060 and 0.054 (Figure 1a and b). Further, the prepared UA-PLGA NPs and Caf-PLGA NPs had zeta potential of −24.8 mV and −14.3 mV. It has been found that 69% of UA and 78% of Caf were encapsulated in PLGA NPs (Table 1). SEM images of the UA-PLGA NPs and Caf-PLGA NPs are shown in Figure 2. The prepared UA-PLGA NPs and Caf-PLGA NPs had smooth surface but with some irregular small particles.
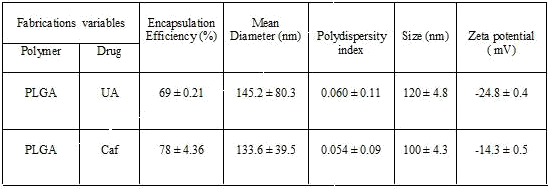
Table 1: The drug encapsulation efficiency, polydispersity index, size and surface charge of the UA-PLGA nanoparticles and Caf-PLGA nanoparticles.
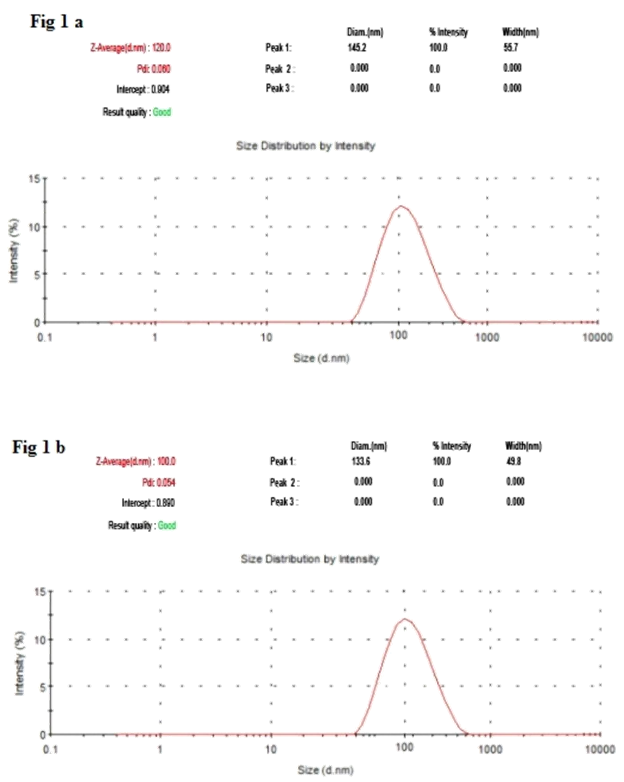
Figure 1A: The size distribution of UA-PLGA nanoparticles by DLS.
Figure 1B: The size distribution of Caf-PLGA nanoparticles by DLS.
Figure 1B: The size distribution of Caf-PLGA nanoparticles by DLS.
Drug encapsulation efficiency and in vitro drug release
Table 1 shows the amount of drug encapsulated in PLGA nanosystem. The encapsulation efficiencies of UA-PLGA NPs and Caf-PLGA NPs are in the range of 69% and 78%. Figure 3 shows the % drug release in PBS during different time interval. After 3h incubation, 7% of UA and 9% of Caf was released in the PBS and the maximum of 69% of UA and 82% of Caf release were observed upon 30 h incubation. Upon incubation with 10% FBS, 7% and 69% UA was released in 3h and 30h and 9% and 82% Caf was released in 3h and 30h respectively.
Table 1 shows the amount of drug encapsulated in PLGA nanosystem. The encapsulation efficiencies of UA-PLGA NPs and Caf-PLGA NPs are in the range of 69% and 78%. Figure 3 shows the % drug release in PBS during different time interval. After 3h incubation, 7% of UA and 9% of Caf was released in the PBS and the maximum of 69% of UA and 82% of Caf release were observed upon 30 h incubation. Upon incubation with 10% FBS, 7% and 69% UA was released in 3h and 30h and 9% and 82% Caf was released in 3h and 30h respectively.
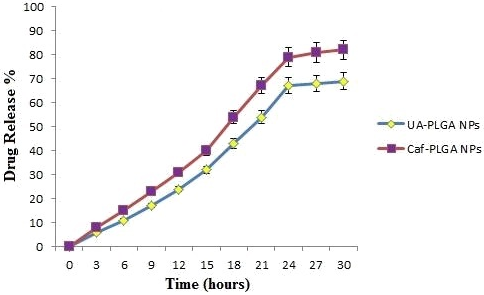
Figure 3: The percentage of UA and Caf released from PLGA nanoparticles during different time intervals in 10% FBS/PBS.
Drug treatment and dose fixation study
Figure 4 shows the % cytotoxicity of UA-PLGA NPs, UA, Caf-PLGA NPs and Caf (6.25, 12.5, 25, 50 and 100 µg) in HT29 cells. Inhibitory concentration 50 (IC50) value for UA-PLGA NPs, UA, Caf-PLGA NPs and Caf were found to be 88.10 µg, 79.28 µg, 49.63 µg and 43.29 µg respectively.
Figure 4 shows the % cytotoxicity of UA-PLGA NPs, UA, Caf-PLGA NPs and Caf (6.25, 12.5, 25, 50 and 100 µg) in HT29 cells. Inhibitory concentration 50 (IC50) value for UA-PLGA NPs, UA, Caf-PLGA NPs and Caf were found to be 88.10 µg, 79.28 µg, 49.63 µg and 43.29 µg respectively.
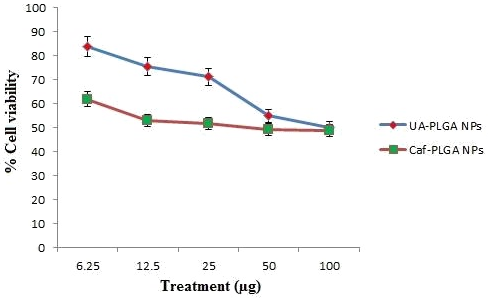
Figure 4: Optimum dose fixation study by MTT assay. (IC50) value for UA-PLGA nanoparticles and Caf-PLGA nanoparticles was found to be 88.10 μg and 69.63 μg, respectively.
Apoptotic morphological changes
Figure 5A shows the photomicrographs of apoptotic morphological changes in UA-PLGA nanoparticles, Caf-PLGA nanoparticles and UA-PLGA nanoparticles + Caf-PLGA nanoparticles treated cells. The % apoptotic cell death was increased during UA-PLGA nanoparticles, Caf-PLGA nanoparticles and UA-PLGA nanoparticles + Caf-PLGA nanoparticles treatment. It was found that treated cells showed 64%, 87 % and 93% of apoptotic cells, respectively (Figure 5B).
Figure 5A shows the photomicrographs of apoptotic morphological changes in UA-PLGA nanoparticles, Caf-PLGA nanoparticles and UA-PLGA nanoparticles + Caf-PLGA nanoparticles treated cells. The % apoptotic cell death was increased during UA-PLGA nanoparticles, Caf-PLGA nanoparticles and UA-PLGA nanoparticles + Caf-PLGA nanoparticles treatment. It was found that treated cells showed 64%, 87 % and 93% of apoptotic cells, respectively (Figure 5B).
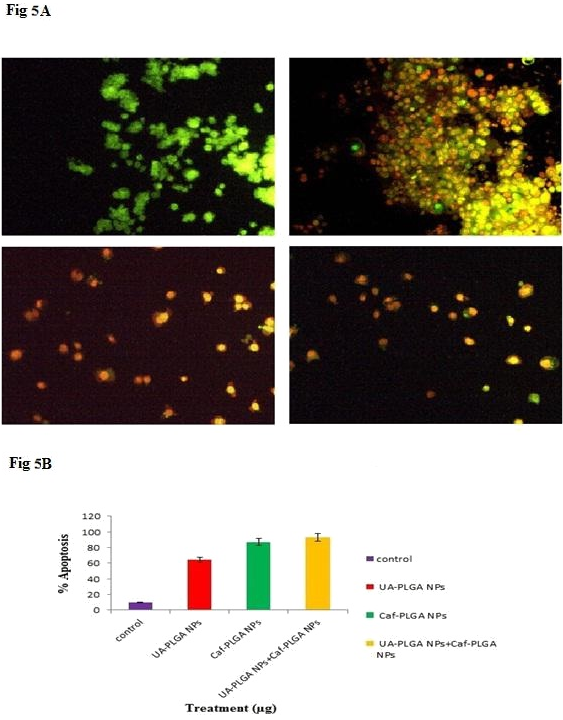
Figure 5A: Orange-red color indicates the occurrence of apoptosis, while green color indicates the absence of apoptosis in HT29 cells.
Figure 5B: Percentage apoptotic cell death was increased in UA-PLGA nanoparticles, Caf-PLGA nanoparticlesand UA-PLGA nanoparticles + Caf-PLGA nanoparticles treated cells.
Figure 5B: Percentage apoptotic cell death was increased in UA-PLGA nanoparticles, Caf-PLGA nanoparticlesand UA-PLGA nanoparticles + Caf-PLGA nanoparticles treated cells.
Alkaline single cell gel electrophoresis
The changes in the levels of DNA damage in nanoparticles treated HT-29 cells were shown (Figure 6A and B). Significant increase in the levels of DNA damage was observed in nanoparticles treated cells when compared to control. Among the three groups, UA-PLGA nanoparticles+Caf-PLGA nanoparticles treated cells showed maximal DNA damage when compared to UA/Caf-PLGA nanoparticles treatment alone. UA-PLGA nanoparticles+Caf-PLGA nanoparticles treated cells showed significantly increased % tail DNA (28%), % tail length (54%) and % tail moment (17%) in HT-29 cells (Figure 6C).
The changes in the levels of DNA damage in nanoparticles treated HT-29 cells were shown (Figure 6A and B). Significant increase in the levels of DNA damage was observed in nanoparticles treated cells when compared to control. Among the three groups, UA-PLGA nanoparticles+Caf-PLGA nanoparticles treated cells showed maximal DNA damage when compared to UA/Caf-PLGA nanoparticles treatment alone. UA-PLGA nanoparticles+Caf-PLGA nanoparticles treated cells showed significantly increased % tail DNA (28%), % tail length (54%) and % tail moment (17%) in HT-29 cells (Figure 6C).
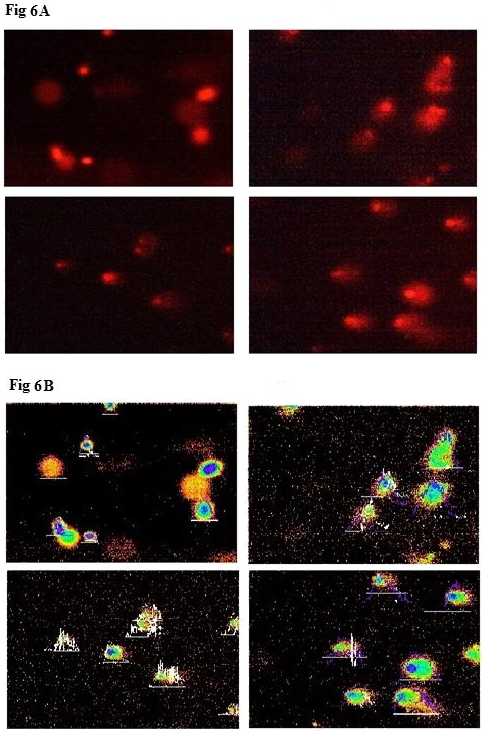
Figure 6A: Shows the photomicrographs of DNA damage (comet assay). The control cell shows largely non-fragmented intact DNA.
Figure 6B: Shows the photomicrographs of DNA damage (comet assay). Comets were scored using Tritek comet scoring software.
Figure 6B: Shows the photomicrographs of DNA damage (comet assay). Comets were scored using Tritek comet scoring software.
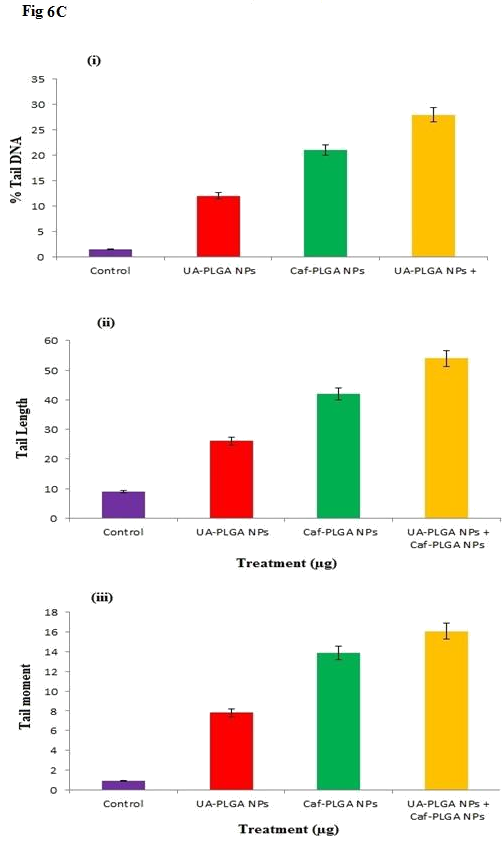
Figure 6C: (i), (ii) and (iii) show the percentage of tail DNA, tail length and tail moment in HT-29.
Discussion
The method used in this work allowed the instantaneous and reproducible formation of UA-PLGA NPs exhibiting diameters below 120 nm and low polydispersity indexes, indicating an homogeneous size distribution. The mean zeta potential of UA-PLGA NPs exhibited a negative value of 24.8 ± 0.4 mV and Caf-PLGA NPs exhibiting diameters below 100 nm and low polydispersity indexes, indicating an homogeneous size distribution. The mean zeta potential of Caf-PLGA NPs exhibited a negative value of 14.3 ± 0.5 mV. The method used in this work allowed the instantaneous and reproducible formation of nanoparticles exhibiting diameter below 120 nm and low polydispersity indexes, indicating an homogeneous size distribution. As mentioned above, these findings were confirmed by the SEM data which also showed that nanospheres were spherical in shape. Nanoparticles were shown to exhibit a negative surface charge which can be attributed to the type of polymer used and more specifically to the presence of polymeric carboxylic groups on the nanoparticle surface [29,30].
Further, we noticed that the PLGA degraded gradually and released the drug in a sustained manner. 7% UA was released in 3h and 69% UA was released in 30 h incubation in the PBS and 9% Caf was released in 3h and 82% Caf was released in 30 h incubation in the PBS. This result indicates that the prepared nanoparticles are useful for controlled delivery system for cancer treatment [31].
We evaluated the anticancer activity of UA-PLGA NPs and Caf-PLGA NPs in HT29 cell line. It was found that UA-PLGA NPs and Caf-PLGA NPs could greatly inhibit the HT29 cell growth. The reason for increased cytotoxicity observed in the UA-PLGA NPs and Caf-PLGA NPs group might be due to increased cellular uptake and sustained drug delivery. Enhanced cytotoxicity during UA-PLGA NPs and Caf-PLGA NPs treatment indicates that PLGA has the potency to transport more UA and Caf into the cells, thus achieving greater cytotoxicity. IC50 values for UA-PLGA NPs and Caf-PLGA NPs in our study were 88.10 µg and 49.63 µg. Previously 88.69 µM value reported before for PTX [32]. We have observed UA-PLGA nanoparticles + Caf-PLGA nanoparticles pretreatment significantly increased apoptotic morphological changes in HT29 cells than UA-PLGA nanoparticles and Caf-PLGA nanoparticles treatment alone. Apoptosis has been shown to be a significant mode of cell death after cytotoxic drug treatment [33]. Further studies warrants to explore the merits of UA-PLGA NPs + Caf-PLGA NPs for cancer chemotherapy.
Comet assay, with the advantage of high sensitivity to single strand break, is suitable for assessing the effect of induced DNA damage. The induction of DNA single strand breaks is often used to predict the tumor cells. The extent of DNA damage was greater in the UA-PLGA nanoparticles+Caf-PLGA nanoparticles treated group compared to UA/Caf-PLGA nanoparticles treated group. Phytochemicals have been reported to induce DNA damage in cancer cells by reactive oxygen species generation [34].
Conclusion
This is the first time that, UA/Caf-PLGA nanoparticle formulation was fabricated by a modified solvent displacement method to overcome multidrug resistance in colorectal cancer cells. The data showed that there was an increased level of uptake of UA-PLGA nanoparticles+Caf-PLGA nanoparticles in colorectal cancer cell lines HT-29 in comparison with UA/Caf-PLGA nanoparticles. The cytotoxicity of UA-PLGA nanoparticles+Caf-PLGA nanoparticles was higher than UA/Caf-PLGA nanoparticle in the HT-29 cell culture. However, the UA-PLGA nanoparticles+Caf-PLGA nanoparticles achieved a significantly higher level of cytotoxicity than both of UA/Caf-PLGA nanoparticles, indicating that UA-PLGA nanoparticles+Caf-PLGA nanoparticles could overcome multidrug resistance in colorectal cancer cells and therefore have considerable therapeutic potential for colorectal cancer.
Disclousure of interest
The authors declare that they have no conflicts of interest concerning this article.
The authors declare that they have no conflicts of interest concerning this article.
References
- Ferlay J, Soerjomataram. I, Ervik. M. (2013). Cancer Incidence and Mortality Worldwide; IARC Cancer Base No. 11. Lyon, France: International Agency for Researh on Cancer 136(5). E359-86.
- Neto CC. (2007). Cranberry and its phytochemicals: a review of in vitro anticancer studies. J Nutr 137 (1 Suppl). 186–193.
- Andre T, Boni C, Mounedji-Boudiaf L et,al. (2004). Oxaliplatin,fluorouracil and leucovorin as adjuvant treatment for colon cancer. N Engl J Med 350(23): 2343-51.
- Biganzoli L, Minisini A, Aapro M, Di Leo A. (2004). Chemotherapy for metastatic breast cancer, Curr. Opin. Obstet. Gynecol 6. 37–41.
- Caddeo C, Teska K, Sinico C, Kristl J. (2008). Effect of resveratrol incorporated in liposomes on proliferation and UV-B protection of cells. International Journal of Pharmcology 363 (1-2). 183-91.
- Leroux JC, Doelker E, Gurny R. (1996). The use of obtained drug-loaded nanoparticles in cancer chemotherapy. In: Benita S, editor. Microencapsulation. New York: Marcel Dekker 535-75.
- Matsumura Y, Maeda H. (1986). A new concept for macromolecular therapeutics in cancer chemotherapy: mechanism of tumoritropic accumulation of proteins and the antitumor agent smancs. Cancer Res 46(12 Pt 1). 6387-92.
- Hashida M, Akamatsu K, Nishikawa M, Yamashita F, Takakura Y. (1999). Design of polymeric prodrugs of prostaglandin E1 having galactose residue for hepatocyte targeting. J Control Release 62(1-2). 253-62.
- Kumari A, Yadav SK, Yadav SC. (2010). Biodegradable polymeric nanoparticles based drug delivery systems. Colloids Surf. B Biointerfaces 75(1). 1-18.
- Limami Y, Pinon A, Leger DY, Mousseau Y, Cook-Moreau J, Beneytout JL., et al. (2011). HT- 29 colorectal cancer cells undergoing apoptosis overexpress COX-2 to delay ursolic acid-induced cell death. Biochimie 93(4): 749-57.
- Zheng QY, Jin FS, Yao C, Zhang T, Zhang GH, Ai X. (2012). Ursolic acid-induced AMP activated protein kinase (AMPK) activation contributes to growth inhibition and apoptosis in human bladder cancer T24 cells. Biochem Biophys Res Commun 419: 741-7.
- Tang HQ, Hu J, Yang L, Tan RX. (2000). Terpenoids and flavonoids from Artemisia species. Planta Med 66(4): 391-3.
- Marquina S, Maldonado N, Garduno-Ramirez ML, Aranda E, Villarreal ML, Navarro V,Bye R, Delgado G, Alvarez L. (2001). Bioactive oleanolic acid saponins and other constituents from the roots of Viguiera decurrens. Phytochemistry 56(1): 93-7.
- Kashiwada Y, Nagao T, Hashimoto A, Ikeshiro Y, Okabe H, Cosentino LM, Lee KH. (2000). Anti-AIDS agents 38. Anti-HIV activity of 3-O-acyl ursolic acid derivatives. J Nat Prod 63(12): 1619-22.
- Alvarez ME, Maria AO, Saad JR. (2002). Diuretic activity of Fabiana patagonica in rats. Phytother Res 16(1): 71-3.
- Assefa H, Nimrod A, Walker L, Sindelar R. (2001). Enantioselective synthesis and complement inhibitory assay of A/B-ring partial analogues of oleanolic acid. Bioorg Med Chem Lett 11. 1619-1623.
- Yoshikawa M, Matsuda H. (2000). Antidiabetogenic activity of oleanolic acid glycosides from medicinal foodstuffs. Biofactors 13: 231-237.
- Li P, Dai NY, Zhang PJ, Wang QA, Wei Q. (2008). Chitosan-alginate nanoparticles as a novel drug delivery system for nifedipine. Int J Biomed Sci 4: 221–8.
- Kesavan PC. (2005). Oxygen effect in radiation biology: Caffeien and serendipity. Current Science 89(2): 318-328.
- Abraham SK. (1991). Inhibitory effects of coffee on the genotoxicity of carcinogens in mice. Mutation Research 262: 109-114.
- Brown I, Shalli K, McDonald SL, Moir SE, Hutcheon AW, Heys SD. (2004). Reduced expression of p27 is a novel mechanism of docetaxel resistance in breast cancer cells. Breast Cancer Res 6(5). 601-7.
- Mathew ME, Mohan JC, Manzoor K, Nair SV, Tamura H, Jayakumar R. (2010). Folate conjugated carboxymethyl chitosan-manganese doped zinc sulphide Nanoparticles for targeted drug delivery and imaging of cancer cells. Carbohydrate polymers 80. 443-449.
- Dong Y, Feng SS. (2004). Methoxy poly(ethylene glycol)-poly(lactide) (MPEG-PLA) nanoparticles for controlled delivery of anticancer drugs. Biomaterials 2843-9.
- Mosmann T. (1983). Rapid calorimetric assay for cellular growth and survival: application of proliferation and cytotoxicity assay. J Immol Methods 65(1-2). 55-63.
- Lakshmi S, Dhanaya GS, Joy B, Padmaja G, Remani P. (2008). Inhibitory effect of an extract of Curcuma Zedoariae on human cervical carcinoma cells. Med Chem Res 17. 335-44.
- Singh NP, McCoy MT, Tice RR, Schneider EL. (1988). A simple technique for quantification of low levels of DNA damage in individual cells. Exp Cell Res 175. 184–91.
- Nagarajan RP, Kasinathan J, Samivel R. (2009). Caffeic acid modulates ultraviolet radiation-B induced oxidative damage in human blood lymphocytes. J Photochem Photobiol B Biol 95. 196–203.
- Dhawan A, Bajpayee M, Devendraparmar. (2009). Comet assay: a reliable tool for the assessment of DNA damage in different models. Cell Biol Toxicol 25. 5-32.
- Mauduit J, Vert M. (1993). Less polymer based acids lactic and glycolic acid delivery control principle acids. STP Pharma Sci 3(3). 197-212.
- Lacasse FX, Filion MC, Philips NC, Escher E, McMullen JN, Hildgen P. (1998). Influence of surface properties at biodegradable microsphere surface: effects on plasma protein adsorption and phagocytosis. Pharm Res 15(2). 312-317.
- Hildeman DA, Mitchell T, Teague TK, Henson P, Day BJ, Kappler J, Marrack PC. (1999). Reactive oxygen species regulate activation-induced T cell apoptosis. Immunity 10. 735-744.
- Tsujimoto Y, Shimizu S. (2007). Role of the mitochondrial membrane permeability transition in cell death. Apoptosis 12. 835–40.
- Zhang M, Boyer M, Rivory L, Hong A, Clarke S, Stevens G, Fife K. (2004). Radiosensitization of vinorelbine and gemcitabine in NCI-H460 non–small-cell lung cancer cells. Int J Radiat Oncol Biol Phys 58(2). 353–360.
- Mcmillan TJ, Steel GG. (1997). DNA damage and cell killing. Basic Clin Radiol London 58–69.
Citation: Jose Merlin JP, Sheeja S Rajan and Subramaniam P. (2018). Treatment for Colorectal Cancer: Ursolic Acid Loaded Poly (Lactic-Co-Glycolic Acid) Nanoparticles and Caffiene Loaded Poly (Lactic-Co-Glycolic Acid) Nanoparticles . Journal of Pharmacy and Drug Development 1(1).
Copyright: © 2018 JP Jose Merlin., et al. This is an open-access article distributed under the terms of the Creative Commons Attribution License, which permits unrestricted use, distribution, and reproduction in any medium, provided the original author and source are credited.

