Research Article
Volume 1 Issue 1 - 2018
Dielectric Studies of Tetra Carboxy Metalphthalocyanines Anchored Phenolphthalein Based Poly (1, 3, 4-Oxadiazole Arylene Ether) S
1Department of Industrial Chemistry, Sahyadri Science College (Autonomous), Kuvempu University, Shivamogga -577 203, Karnataka, India
2Department of Chemistry, Vijayanagara Sri Krishnadevaraya University, Bellary-583 105, Karnataka, India
3Department of Chemistry, Acharya Institute of Technology, Hesaraghatta Main Road, Bangalore- 560090, Karnataka, India
4Department of Industrial Chemistry, Kuvempu University, Shankaraghatta-577 451, Karnataka, India
5Department of Physics, Government Science College, Chitradurga-577 501, Karnataka, India
*Corresponding Author: Venugopala KR Reddy, Department of Chemistry, Vijayanagara Sri Krishnadevaraya University, Bellary-583 105, Karnataka, India.
Received: November 21, 2018; Published: December 05, 2018
Abstract
The high dielectric constant phenolphthalein based poly(1,3,4-oxadiazole aryl ether) (PHOP) was successfully synthesized by structural modification using tetra carboxy metalphthalocyanine (TCMPc, M = Co, Ni & Cu) macrocycles with a stochiometric ratio (10, 20 & 30 wt%) to yield further enhanced dielectric constant polymer embedded metalphthalocyanine (PPETCP 1–9) to place it in advance studies. All the tailor-made polymers were well characterized by Solid State UV-Vis, thermogravimetric analysis (TGA) and XRD analysis. FTIR and Solid State 13C–NMR spectroscopic techniques confirms MPc units are grafted in to the polymer matrix and act as a utmost light catching materials in the visible region (400 to 800 nm) with notable drop off in optical band gap. The electron hopping model was used to explain the variation of AC conductivity with frequency and the conductivity values of PPETCP 1–9 are in the range of 3.43x10⁻⁵ to –5.14x10⁻⁵ (S/m) at 5 MHz measured at room temperature.
Keywords: Tailor-made polymers; Metalphthalocyanine; Poly (1,3,4-oxadiazole-arylene ether); Dielectric properties
Introduction
High-performance electroactive polymers with high dielectric constant have been used in different areas such as, in actuators, arti?cial muscles, high efficiency charge storage capacitors and so forth [1–4]. Nowadays, the utility of such polymers were catching the attention because of their many salient features, such as light weight, high mechanical flexibility and conformability [5,6]. 1,3,4-Oxadiazoles are a class of signi?cant heterocyclic compounds used in polymer preparation and its utmost exploitation in materials science [7,8]. The 1,3,4-oxadiazole incorporation into the poly(arylene-ether) to develop an important class of high performance electroactive polymers having an outstanding capability of transporting electrons, especially its good thermal stability and antioxygenation given by its special structure [9], but the polymers generally suffer from a low dielectric constant 2.98–3.5 reported by C. Hamciuc., et al. [10, 11].
Consequently, one of the focuses of these research and development effort is to raise the dielectric constant substantially with retaining other excellent performance and make it to be an advanced polymer by altering its structural frameworks with active macrocycles and functional groups needs worthy solubility criterion. This can be achieved by incorporating ?exible bonds, large pendent groups or polar substituents such as nitriles, sulfonic, carboxylic acid into the polymer chain. The introduction of pendent bulky groups along with the polymer backbone results in a less ordered polymer matrix increasing the solubility characteristics [12–15]. Recently, we reported phenolphthalein based poly(1,3,4-oxadiazole arylene ether) (PHOP) containing carboxylic acid pendants was synthesized with good solubility and exhibits highest dielectric constant 300 at 50 Hz frequency measured at room temperature [16], a marked improvement was noticed as we compared PHOP with the currently available polymers. The great extent enhancement of dielectric constant is due to rapid exchange of high concentration of H+ ions in the polymer matrix by the application of electric field.
It is an effective way to enhance the dielectric constant of the polymer further by grafting with high dielectric constant materials. Metalphthalocyanine (MPc) and metal porphyrins are well known transition metal macrocyclic complexes which exhibits high dielectric constant. Several reports were documented for the development of high dielectric constant polymer composites involving MPc [16–23], but the main drawback of composite preparation is non-uniform distribution of MPc in the polymer matrix. In our recent study, we reported the enhancement of dielectric constant of the polymer by introducing high dielectric constant tetra amino metalphthalocyanine into the polymer by an effective way [16]. The enhancement of dielectric constant of the polymer and the characteristics of 1,3,4-oxadiazole was kept in mind, the synthetic skills developed by the researchers have allowed to acquire the exciting structures. In this article, we report high-performance electroactive metal containing polymers to place in latter thought tenacity. We have recently reported PHOP [16].
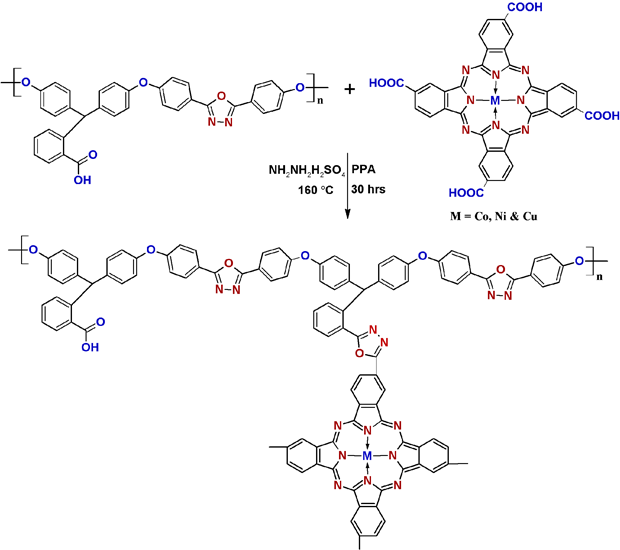
The PHOP was modified with tetra carboxy metalphthalocyanine (TCMPc, M = Co, Ni & Cu) via 1,3,4-oxadiazole bridges using polyphosphoric acid (PPA) assisted condensation followed by cyclization reaction with hydrazine sulphate [24–27] to afford phenolphthalein polymer embedded tetra carboxy metalphthalocyanines (PPETCP 1–9) (Scheme 1). MPc insertion into the polymer was clearly confirmed by electronic spectra and supports other spectroscopic techniques. TCMPc inclusion into PHOP was varied stochiometrically as 10, 20 and 30 weight% results in high dielectric constant polymeric materials PPETCP 1–9 and possesses low dielectric loss in the measure frequency range (50 Hz – 5 MHz). The variation of weight fractions of TCMPc limits to 30%, because 30% incorporation results insolubility of the polymer and difficult in processing for further studies. The ensuing polymers were characterized with FTIR, 1H-NMR, solid state 13C-NMR spectroscopic techniques, optical and electrical properties have been performed. A significant advantage of this approach is that a great variety of metals can be introduced into polymer through the inclusion of TCMPc as side groups.
Experimental
Materials
Polyphosphoric acid (PPA) and hydrazine sulphate were obtained from Spectrochem Chemicals and used as received. Other reagents and solvents were research grade and used as received. The PHOP containing the carboxylic acid groups was synthesized by a conventional polymerization method reported by us [16]. TCMPc [M = Co, Ni & Cu] were prepared according to the described procedure [28].
Polyphosphoric acid (PPA) and hydrazine sulphate were obtained from Spectrochem Chemicals and used as received. Other reagents and solvents were research grade and used as received. The PHOP containing the carboxylic acid groups was synthesized by a conventional polymerization method reported by us [16]. TCMPc [M = Co, Ni & Cu] were prepared according to the described procedure [28].
Synthesis
Phenolphthalein based poly (1, 3, 4-oxadiazole arylene ether) s (PHOP)
PHOP with pendant carboxyl groups was synthesized by the nucleophilic aromatic substitution reaction reported by us [16].
Phenolphthalein based poly (1, 3, 4-oxadiazole arylene ether) s (PHOP)
PHOP with pendant carboxyl groups was synthesized by the nucleophilic aromatic substitution reaction reported by us [16].
General procedure for the synthesis of 2, 9, 16, 23–tetracarboxymetalphthalocyanine (TCMPc). TCMPc was synthesized by the reported synthetic protocol and the characterized data’s matched well with the literature results [28].
General procedure for PHOP embedded TCMPc (M = Co, Ni & Cu) [PPETCP 1–9]
The modification of PHOP was carried out using PPA as dehydrating agent followed by cyclization at 150°C for 24h. In a typical reaction, 500 mg of PHOP, 50 mg (10 wt %) of TCNiPc and 26.13 mg of hydrazine sulphate (0.2 mmol) was mixed well in a quartz mortar, then transfer into a 250 ml round bottom flask. Add preheated 50g PPA containing 5g of P2O5 and the reaction mixture was maintained at 150°C for 24h. The fibrous green PPETCP polymers were filtered after pouring in to 300 ml water. The product obtained was treated with 0.1M sodium bicarbonate solution followed by water to remove unreacted TCNiPc and dried in a vacuum oven at 100°C overnight. The same procedure was repeated for 20% and 30% TCMPc to afford PPETCP 1–9 show in Scheme 1.
The modification of PHOP was carried out using PPA as dehydrating agent followed by cyclization at 150°C for 24h. In a typical reaction, 500 mg of PHOP, 50 mg (10 wt %) of TCNiPc and 26.13 mg of hydrazine sulphate (0.2 mmol) was mixed well in a quartz mortar, then transfer into a 250 ml round bottom flask. Add preheated 50g PPA containing 5g of P2O5 and the reaction mixture was maintained at 150°C for 24h. The fibrous green PPETCP polymers were filtered after pouring in to 300 ml water. The product obtained was treated with 0.1M sodium bicarbonate solution followed by water to remove unreacted TCNiPc and dried in a vacuum oven at 100°C overnight. The same procedure was repeated for 20% and 30% TCMPc to afford PPETCP 1–9 show in Scheme 1.
PHOP embedded CoTCPc (10, 20 & 30 wt %) (PPETCP 1–3).
Yield: 90%. IR [(KBr) υ max/cm-1]: 3404–3415 (COO–H), 2924 (C–H), 1656–1672 (-C=O of acid), 1589–1598 (C=N), 1488 (C=C), 1237–1240 (C–O–C), 1168 (-C–O), 1098, 1011, 931–948 (=C–O–C=), 840–842, 740–744 (Pc skeleton). UV–Vis (solid state λmax/nm) 434, 663–683.
Yield: 90%. IR [(KBr) υ max/cm-1]: 3404–3415 (COO–H), 2924 (C–H), 1656–1672 (-C=O of acid), 1589–1598 (C=N), 1488 (C=C), 1237–1240 (C–O–C), 1168 (-C–O), 1098, 1011, 931–948 (=C–O–C=), 840–842, 740–744 (Pc skeleton). UV–Vis (solid state λmax/nm) 434, 663–683.
PHOP embedded NiTCPc (10, 20 & 30 wt %) (PPETCP 4–6).
Yield: 89%. IR [(KBr) υmax/cm-1]: 3382–3393 (COO–H), 2921 (C–H), 1651–1654 (-C=O of acid), 1598 (C=N), 1486–1488 (C=C), 1238–1240 (C–O–C), 1167 (-C–O), 1094–1097, 1011, 930–959 (=C–O–C=), 839, 737–756 (Pc skeleton). UV–Vis (solid state λmax/nm) 434, 648–658. 13C–NMR (solid state) δ ppm; 162 (oxadiazole C), 146 (C=N), 121–128 (Ar–C), 58 (methine– C).
Yield: 89%. IR [(KBr) υmax/cm-1]: 3382–3393 (COO–H), 2921 (C–H), 1651–1654 (-C=O of acid), 1598 (C=N), 1486–1488 (C=C), 1238–1240 (C–O–C), 1167 (-C–O), 1094–1097, 1011, 930–959 (=C–O–C=), 839, 737–756 (Pc skeleton). UV–Vis (solid state λmax/nm) 434, 648–658. 13C–NMR (solid state) δ ppm; 162 (oxadiazole C), 146 (C=N), 121–128 (Ar–C), 58 (methine– C).
PHOP embedded CuTCPc (10, 20 & 30 wt %) (PPETCP 7–9).
Yield: 91%. IR [(KBr) υmax/cm-1]: 3386–3419 (COO–H), 2927 (C–H), 1652 (-C=O of acid), 1598 (C=N), 1487 (C=C), 1240 (C–O–C), 1167 (-C–O), 1095–1098, 1011, 957–960 (=C–O–C=), 839, 735–737 (Pc skeleton). UV–Vis (solid state λmax/nm) 434, 650–655.
Yield: 91%. IR [(KBr) υmax/cm-1]: 3386–3419 (COO–H), 2927 (C–H), 1652 (-C=O of acid), 1598 (C=N), 1487 (C=C), 1240 (C–O–C), 1167 (-C–O), 1095–1098, 1011, 957–960 (=C–O–C=), 839, 735–737 (Pc skeleton). UV–Vis (solid state λmax/nm) 434, 650–655.
Characterization
Spectral Analysis
Infrared (IR) spectra were recorded on a FT–IR 8400s Shimadzu spectrometer in KBr pellets. Solid state electronic absorption spectra were recorded on a Perkin-Elmer UV–Vis spectrometer, model UV/VIS-35. Solid-state 13C–NMR spectra were recorded on a Bruker DSX-300 solid-state NMR spectrometer with a magnetic field of 7.04T and carbon frequency of 75.47 MHz (internal standard was glycine). Thermal analysis was carried out in SHIMADAZU TA–60WS thermal analyzer in air at a heating rate of 5°C min-1. Powdered XRD measurements were carried out on a Bruker D8 Advance X–ray diffractrometer. The dielectric and AC conductivity measurements were carried out using impedance analyzer model HIOKI 3352–50 HiTESTER Version 2.3.
Electrical measurements
Devices were fabricated in a sandwich configuration Ag/Polymer/Ag with powdered PHOP and PPETCP 1–9 samples compressed into pellets and conducting silver paint (ELTECKS preparation No. 1228–C) was coated on both flat surfaces of the pellets and the electrical contacts to the samples were made using the same silver paint to the electrodes. The electrical contacts were checked to verify the ohmic connection. The dielectric and AC conductivity measurements were carried out using impedance analyzer model HIOKI 3352–50 HiTESTER Version 2.3. The measurements were carried out at room temperature in between the 50Hz–5MHz. The capacitance value (C) and AC conductance (G) were directly obtained from the instrument. The dielectric constant (ε′) and AC conductivity (σac) values are calculated using the relations ε′=Cpd/εoA and σac=Gd/A respectively. Where, ‘d’ is the thickness of the sample and ‘A’ is the cross-section area and εo is the permittivity of the free space.
Devices were fabricated in a sandwich configuration Ag/Polymer/Ag with powdered PHOP and PPETCP 1–9 samples compressed into pellets and conducting silver paint (ELTECKS preparation No. 1228–C) was coated on both flat surfaces of the pellets and the electrical contacts to the samples were made using the same silver paint to the electrodes. The electrical contacts were checked to verify the ohmic connection. The dielectric and AC conductivity measurements were carried out using impedance analyzer model HIOKI 3352–50 HiTESTER Version 2.3. The measurements were carried out at room temperature in between the 50Hz–5MHz. The capacitance value (C) and AC conductance (G) were directly obtained from the instrument. The dielectric constant (ε′) and AC conductivity (σac) values are calculated using the relations ε′=Cpd/εoA and σac=Gd/A respectively. Where, ‘d’ is the thickness of the sample and ‘A’ is the cross-section area and εo is the permittivity of the free space.
Results and Discussion
absorption band in the region of 600–800 nm. This way maximum incorporation of TCMPc was achieved with inclusion percentage limit to 30 wt%. At higher ratios, aggregation of phthalocyanine (Pc) compounds occurs by association of the macrocyclic rings [29] and insoluble materials results. So, 10, 20% PPETCP shows solubility in N,N-dimethylformamide (DMF), N,N-dimethylacetamide (DMAc) and dimethyl sulphoxide (DMSO) and 30% PPETCP was insoluble. After MPc insertion the thermal stability slightly decreases was noticed, because of the side chain decomposition. Further, the successive oxadiazole construction between the TCMPc and the polymer has been confirmed by using FTIR and solid state 13C-NMR techniques.
Solid state 13C-NMR Spectra
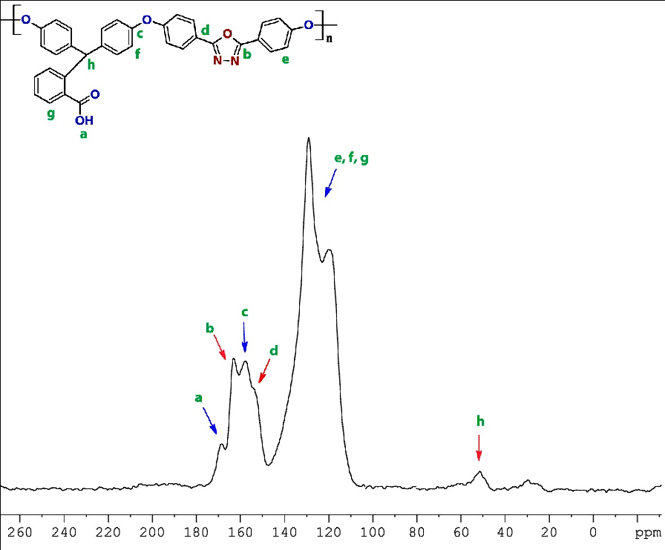
The 1H-NMR spectra of PHOP polymer confirms the composition of the polymer is similar to the composition of the reactants used for the synthesis [16]. Here 30% NiTCPc embedded polymer (PPETCP 6) shows insolubility and need for its structural characterization; we are planning to go for solid state 13C-NMR spectra. Further solid state 13C spectra of PHOP are not necessary for its structural prediction, but it was needful for the structural comparison with PPETCP 6. Figure 1 illustrates the solid state 13C-NMR spectra of PHOP with the assignments of all the carbons. It exhibits the expected broad signal at 120–129 ppm for aromatic carbons and the peak at 52 ppm was identified as the chemical shift of methine carbon. The peak at 158 ppm for the electron donating natured ether linkage attached to aromatic carbons (C–O–C), the oxadiazole moiety attached to aromatic carbons show signal at 154 ppm. The electron withdrawing character oxadiazole ring carbons shows a peak at downfield region 163 ppm compare to ether link carbons and finally –COOH groups exhibit a peak at higher field 169 ppm shownin Figure 1. The 13C–NMR spectra of the polymer support the structure.
The 1H-NMR spectra of PHOP polymer confirms the composition of the polymer is similar to the composition of the reactants used for the synthesis [16]. Here 30% NiTCPc embedded polymer (PPETCP 6) shows insolubility and need for its structural characterization; we are planning to go for solid state 13C-NMR spectra. Further solid state 13C spectra of PHOP are not necessary for its structural prediction, but it was needful for the structural comparison with PPETCP 6. Figure 1 illustrates the solid state 13C-NMR spectra of PHOP with the assignments of all the carbons. It exhibits the expected broad signal at 120–129 ppm for aromatic carbons and the peak at 52 ppm was identified as the chemical shift of methine carbon. The peak at 158 ppm for the electron donating natured ether linkage attached to aromatic carbons (C–O–C), the oxadiazole moiety attached to aromatic carbons show signal at 154 ppm. The electron withdrawing character oxadiazole ring carbons shows a peak at downfield region 163 ppm compare to ether link carbons and finally –COOH groups exhibit a peak at higher field 169 ppm shownin Figure 1. The 13C–NMR spectra of the polymer support the structure.
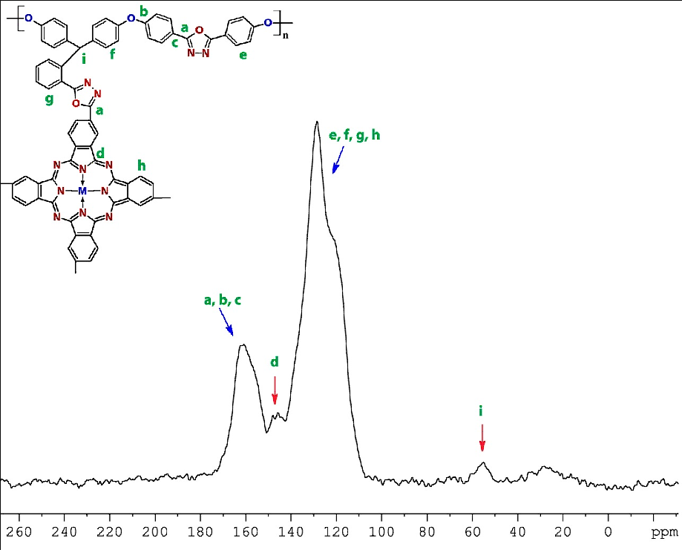
Solid state 13C–NMR spectra of PPETCP 6 presented in Figure 2, confirms the inclusion of NiTCPc into PHOP; the methine carbon show peak at 58 ppm, it is somewhat deshielded due to the presence of electron withdrawing oxadiazole moiety as compare to bare PHOP. The oxadiazole connection was confirmed by the disappearance of –COOH peak at 169 ppm and the aromatic carbons of Pc and polymer was overlapped in the range from 121–128 ppm. The oxadiazole ring carbons shows a peak at 162 ppm and carbon attached to nitrogen exhibit the peak at 146 ppm. The shoulder nature of peaks in the 13C–NMR spectra of PHOP was disappeared after NiTCPc inclusion. As a result, 13C–NMR spectra indicated that PPETCP 6 was synthesized as desired. Unfortunately, 13C–NMR spectroscopy is uninformative for cobalt and copper polymers because the paramagnetic character of the cobalt and copper centre prevents the resolution of the signals [29].
Solubility
The PHOP was soluble in polar solvents like N-methyl pyrrolidone (NMP), DMAc, DMF, DMSO and in less polar solvents like dichloroethane (DCE), pyridine, tetrahydrofuran (THF). The PPETCP 1–5, 7 & 8 are soluble in DMF, DMAc and DMSO, except PPETCP 6 & 9 because of aggregation of Pc in the polymer matrix and the solubility data’s are depicted in Table 1.
The PHOP was soluble in polar solvents like N-methyl pyrrolidone (NMP), DMAc, DMF, DMSO and in less polar solvents like dichloroethane (DCE), pyridine, tetrahydrofuran (THF). The PPETCP 1–5, 7 & 8 are soluble in DMF, DMAc and DMSO, except PPETCP 6 & 9 because of aggregation of Pc in the polymer matrix and the solubility data’s are depicted in Table 1.
| Samples | NMP | DMAC | DMF | DMSO | DCE | Acetone | THF |
| PHOP | + | + | + | + | + | - | + |
| PPEMP1 | - | + | + | + | - | - | - |
| PPEMP2 | - | + | + | + | - | - | - |
| PPEMP3 | - | - | - | ++ | - | - | - |
| PPEMP4 | - | + | + | + | - | - | - |
| PPEMP5 | - | + | + | + | - | - | - |
| PPEMP6 | - | - | - | - | - | - | - |
| PPEMP7 | - | + | + | + | - | - | - |
| PPEMP8 | - | + | + | + | - | - | - |
| PPEMP9 | - | - | - | - | - | - | - |
Table 1: Solubility data for the PHOP and PPETCP 1-9.
The solubility was determined at 10% solid content; +, soluble at room temperature, the solid polymer was completely dissolved in the solvent to afford a clean, homogeneous solution; ++, soluble upon heating; −, insoluble; the solid polymer not dissolve in the solvent.
Solid State Electronic Spectra
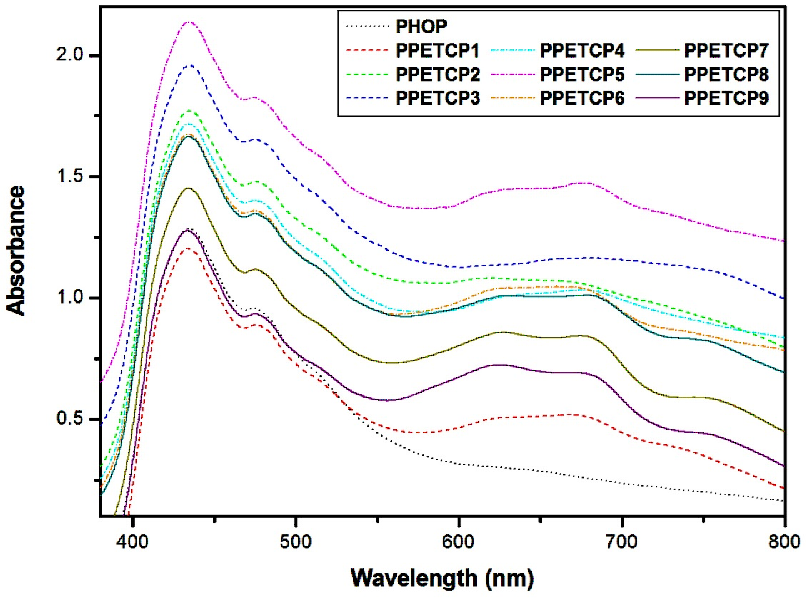
The UV–Vis spectrum of PHOP and after functionalization with TCMPc was depicted in Figure 3. The PHOP show transition at 434 nm and TCMPc shows B-band transition at 434 nm and Q-band transition varied depending on metal centre, CoTCPc, NiTCPc and CuTCPc exhibited Q-band transitions at 565, 550 and 580 nm respectively. After inclusion of TCMPc into PHOP ensuing polymers displayed two absorption bands, one is B-band transition at 434 nm in the blue end of the visible spectrum and other is Q-band transition in the range of 648–683 nm in the red end of the visible spectrum for different metal centred polymers. The CoTCPc, NiTCPc and CuTCPc incorporated PHOP (PPETCP 1–9) exhibited Q-band transitions in the range of 663–683 nm, 648–658 nm and 650–655 nm respectively and the electronic absorption spectra are presented in Figure 3.
The UV–Vis spectrum of PHOP and after functionalization with TCMPc was depicted in Figure 3. The PHOP show transition at 434 nm and TCMPc shows B-band transition at 434 nm and Q-band transition varied depending on metal centre, CoTCPc, NiTCPc and CuTCPc exhibited Q-band transitions at 565, 550 and 580 nm respectively. After inclusion of TCMPc into PHOP ensuing polymers displayed two absorption bands, one is B-band transition at 434 nm in the blue end of the visible spectrum and other is Q-band transition in the range of 648–683 nm in the red end of the visible spectrum for different metal centred polymers. The CoTCPc, NiTCPc and CuTCPc incorporated PHOP (PPETCP 1–9) exhibited Q-band transitions in the range of 663–683 nm, 648–658 nm and 650–655 nm respectively and the electronic absorption spectra are presented in Figure 3.
After TCMPc incorporation, a large shift in Q-band and broad range of absorption was seen as compared to TCMPc. By this we conclude that MPc grafting with polymer results extension of conjugation and more delocalization of π-electrons leads large Q-band shift and broad visible light absorption. Here both B and Q-band transition is attributed by π-π* transition of PPETCP 1–9. Figure 3 shows some interesting observation, as the variation of TCMPc increases its extinction coefficient increase, but PPETCP 6 & 9 shows less extinction coefficient compare to PPETCP 5 & 8 due to certain amount of aggregation of Pc in PPETCP 6 & 9, it reduces extinction coefficient of the Q band to some extent [29]. This can be further confirmed by solubility data, the 30% NiTCPc and 30% CuTCPc (PPETCP 6 & 9) incorporated PHOP showed insolubility due to some extent of aggregation as compare to PPETCP 5 & 8.
Optical band gaps of PHOP and PPETCP 1–9 were determined by the absorption lower edge of the absorption spectrum of each sample in the solid state and the data are summarized in Table 2. Since interactions of TCMPc macromolecules with the polymer chain causes movement of electrons and alter the energy band gap between valence and conduction bands.
| Samples | Peaks λmax(nm) | Band gap(eV) |
| PHOP | 432? | 1.70 |
| PPETCP1 | 434 | 1.85 |
| 667 | 1.33 | |
| PPETCP2 | 434 | 1.64 |
| PPETCP3 | 663 | 1.04 |
| 434 | 1.59 | |
| PPETCP4 | 683 | 1.06 |
| 434 | 1.85 | |
| 658 | 1.10 | |
| PPETCP5 | 434 | 1.60 |
| PPETCP6 | 648 | 1.13 |
| 434 | 1.79 | |
| PPETCP7 | 651 | 1.31 |
| PPETCP8 | 434 | 1.76 |
| 653 | 1.47 | |
| 434 | 1.67 | |
| PPETCP9 | 650 | 1.28 |
| 434 | 1.79 | |
| 655 | 1.48 |
Table 2: Optical band gap data for the PHOP and PPETCP 1-9.
FTIR Spectra
The IR spectrum of PPETCP 1–9 shows almost the same position of the peaks in the range of 2921–2927 (C–H), 1589–1598 (C=N), 1486–1488 (C=C) and 1167–1168 cm-1 (-C–O) found in all the polymeric materials. The characteristic absorption bands appeared at 1237–1240 cm-1 due to the presence of aromatic ether (C–O–C) linkages. Even after 30 % TCMPc inclusion into polymer the presence of free acid functionality was confirmed by IR but at low concentration as compare to bare PHOP. Its absorption region shift from 3447 cm-1 to somewhat low frequency range around 3386–3419 cm-1 (COO-H) due to hydrogen bonding [30] and carbonyl stretching of the pendant carboxylic group at around 1651–1672 cm-1. Finally the oxadiazole formation was confirmed by the absorption bands appearing at 1094–1099, 1011 & 931–960 cm-1 were characteristic of (=C-O-C=) stretching frequency in 1, 3, 4-oxadiazole rings [10]. IR spectrum PPETCP 1–9 displayed some additional stretching bands in the range of 839–844 and 735–756 cm-1due to Pc skeleton vibrations. The assigned absorption bands are reasonably consistent with the suggested structures.
The IR spectrum of PPETCP 1–9 shows almost the same position of the peaks in the range of 2921–2927 (C–H), 1589–1598 (C=N), 1486–1488 (C=C) and 1167–1168 cm-1 (-C–O) found in all the polymeric materials. The characteristic absorption bands appeared at 1237–1240 cm-1 due to the presence of aromatic ether (C–O–C) linkages. Even after 30 % TCMPc inclusion into polymer the presence of free acid functionality was confirmed by IR but at low concentration as compare to bare PHOP. Its absorption region shift from 3447 cm-1 to somewhat low frequency range around 3386–3419 cm-1 (COO-H) due to hydrogen bonding [30] and carbonyl stretching of the pendant carboxylic group at around 1651–1672 cm-1. Finally the oxadiazole formation was confirmed by the absorption bands appearing at 1094–1099, 1011 & 931–960 cm-1 were characteristic of (=C-O-C=) stretching frequency in 1, 3, 4-oxadiazole rings [10]. IR spectrum PPETCP 1–9 displayed some additional stretching bands in the range of 839–844 and 735–756 cm-1due to Pc skeleton vibrations. The assigned absorption bands are reasonably consistent with the suggested structures.
Thermogravimetric Analysis (TGA)
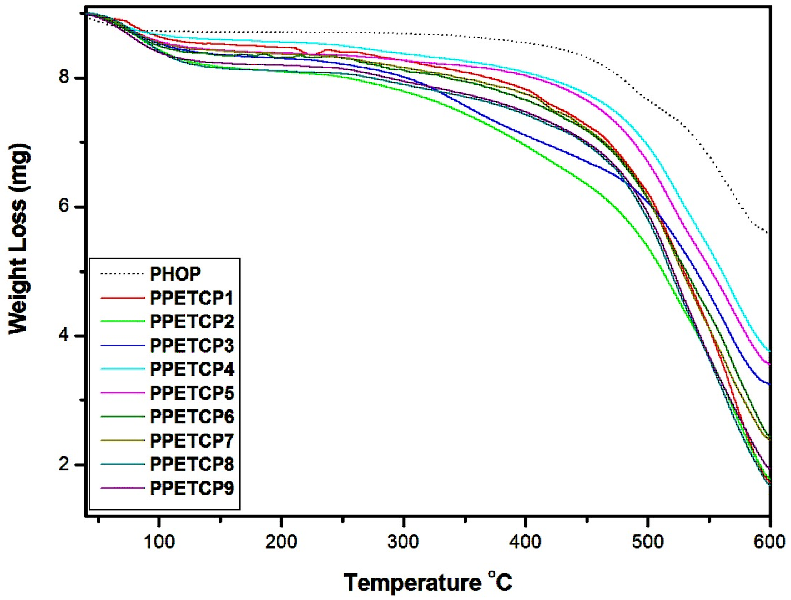
The thermogravimetric studies of all the polymers were carried out in an air atmosphere (Figure 4). The TGA curves of PPETCP 1–9 obtained illustrate the decrease in sample mass with linear increase in temperature, exhibited appreciable thermal stability >325°C. All polymers exhibited two-step degradation pattern, the first one was observed around 130–150°C, which was attributed due to the loss of absorbed moisture in the polymers.
The thermogravimetric studies of all the polymers were carried out in an air atmosphere (Figure 4). The TGA curves of PPETCP 1–9 obtained illustrate the decrease in sample mass with linear increase in temperature, exhibited appreciable thermal stability >325°C. All polymers exhibited two-step degradation pattern, the first one was observed around 130–150°C, which was attributed due to the loss of absorbed moisture in the polymers.
The second weight loss of bare PHOP from 360–600°C, a large decomposition range was observed. It starts with the loss of carboxylic acids pendants (around 350–400°C) [29], after complete decarboxylation the main chain degradation starts and it was seen up to 600°C. The high thermal stability of PHOP was due to the presence of thermal inertness shown by 1,3,4-oxadiazoles in the polymer chain. The second step degradation of PPETCP 1–9 shows a decreased thermal stability and varied decomposition temperature range depends on metal centre. The decrease of thermal stability can be attributed to the presence of non-polar pendant groups. As reported, the transition from polar functions to non-polar groups results in a decrease in the stability due to the reduction of the intermolecular attractive forces in the polymer [29,31]. Decomposition of PPETCP 1–3, PPETCP 4–6 and PPETCP 7–9 exhibited varied thermal stability range of an almost similar pattern 325–600°C, 350–600°C and 335–600°C respectively, a slight decreased stability is observed as compare to PHOP and the decomposition ranges of PPETCP 1-9 was clearly mentioned in Table 3.
| Samples | Decomposition Range (°C) | Ea (kJ/mol) | lnA | ?H (kJ/mol) | ?S kJ/K | ?G kJ/mol |
| PHOP | 360-600 | 0.004241 | -8.6975 | -6.2563 | -161.51 | 121.61 |
| PPETCP1 | 325-600 | 0.010997 | -7.1308 | -6.1030 | -161.02 | 118.42 |
| PPETCP2 | 325-600 | 0.010944 | -7.1064 | -6.1040 | -160.14 | 117.77 |
| PPETCP3 | 325-600 | 0.006811 | -7.9614 | -6.1080 | -160.53 | 118.07 |
| PPETCP4 | 350-600 | 0.007069 | -7.9193 | -6.2118 | -161.17 | 120.54 |
| PPETCP5 | 350-600 | 0.007836 | -7.7419 | -6.2110 | -161.03 | 120.45 |
| PPETCP6 | 350-600 | 0.010516 | -7.1901 | -6.2083 | -160.61 | 120.13 |
| PPETCP7 | 335-600 | 0.010243 | -7.2562 | -6.1492 | -160.82 | 119.08 |
| PPETCP8 | 335-600 | 0.012475 | -6.8510 | -6.1440 | -160.59 | 118.91 |
| PPETCP9 | 335-600 | 0.011667 | -6.9920 | -6.1448 | -160.64 | 118.95 |
Table 3: Kinetic and thermodynamic parameters for the PHOP and PPETCP 1-9.
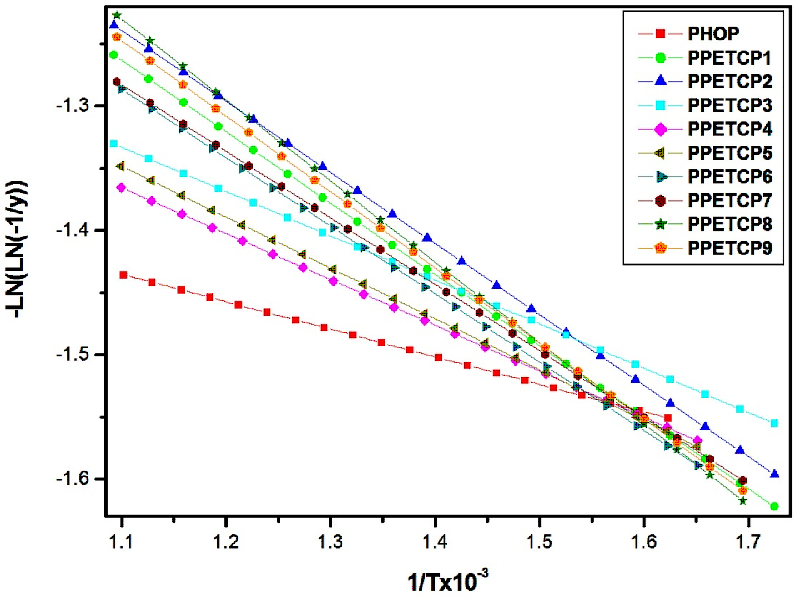
Kinetic parameters study is to know the thermal oxidative stability (TOS) of the materials via accelerated thermal techniques. Different methods are there to explore the kinetic parameters, among them most probable kinetic model has allows the reliable values that method to be employed. In particular, we have used TGA to characterize the degradation pathways of the PHOP and PPETCP 1–9 and kinetic parameters were computed using Broido’s method [32]. Because in Broido's method, the thermal degradation process was considered to be of ?rst-order and the analysis was done easily using standard equations. Plots of -Ln (ln (-1/y)) versus 1/T (Figure 5) (where ‘y’ is the fraction of the compound undecomposed) were developed for the decomposition segment. The slopes of the plots are determined and used to evaluate the activation energies of the PHOP and PPETCP 1–9. The activation energy and other kinetic parameters are in?uenced by the variation of the metal atom present in the polymer. The pre-exponential factor (A) is related to collision number, i.e. number of collisions dm-3s-1. The high value of A indicates that the thermal degradation reaction is very fast [30]. For each step in the decomposition sequence, it was possible to determine the following thermal parameters such as activation energy (Ea), enthalpy (ΔH), entropy (ΔS), free energy (ΔG) and pre-exponential factor (A) using Broido’s method and the values are summarized in Table 3.

Figure 5: Plots of –Ln (ln (-1/y)) vs 1/T x 10-3 for the second step decomposition for the PHOP and PPETCP 1–9.
XRD Analysis
The direct method of investigation of the crystallinity or amorphous nature of a polymer is the X-ray diffraction analysis. The X-ray diffraction pattern of PHOP, PPETCP 1–9 shows broad peaks. The broad peak exhibited PHOP is amorphous in nature and it engaged with TCMPc results extended conjugation and the greater π-electron region influences the stacking of PPETCP in parallel molecules and the PPETCP 1–9 materials were amorphous in nature.
The direct method of investigation of the crystallinity or amorphous nature of a polymer is the X-ray diffraction analysis. The X-ray diffraction pattern of PHOP, PPETCP 1–9 shows broad peaks. The broad peak exhibited PHOP is amorphous in nature and it engaged with TCMPc results extended conjugation and the greater π-electron region influences the stacking of PPETCP in parallel molecules and the PPETCP 1–9 materials were amorphous in nature.
AC electrical measurements
The electrical properties were executed for PHOP and PPETCP 1–9 in the form of compressed pellet Ag/Polymer/Ag in the frequency range of 50 Hz to 5 MHz utilizing an oscillating voltage with amplitude 1V peak-to-peak. Results have been reported for pellets of polymeric materials maintained under vacuum.
The electrical properties were executed for PHOP and PPETCP 1–9 in the form of compressed pellet Ag/Polymer/Ag in the frequency range of 50 Hz to 5 MHz utilizing an oscillating voltage with amplitude 1V peak-to-peak. Results have been reported for pellets of polymeric materials maintained under vacuum.
Frequency dependence of dielectric constant (ε′)
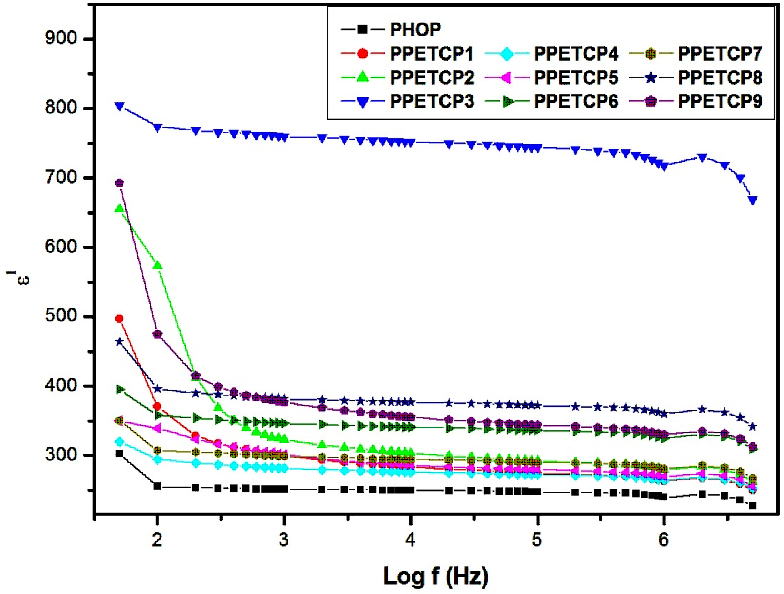
Figure 6 shows variation of dielectric constant (ε′) with frequency for the PHOP and PPETCP 1–9 at room temperature. The ε′ of polymers gradually decreased with increasing frequency because the response of the electronic, atomic and dipolar polarizable units vary with frequency. The ε′ values are attributed due to the charge carriers present in the polymeric material, which migrate upon the application of the field and cause decrease in ε′ due to decrease in space charge carries or interfacial polarization in the polymeric material [33,34].
Figure 6 shows variation of dielectric constant (ε′) with frequency for the PHOP and PPETCP 1–9 at room temperature. The ε′ of polymers gradually decreased with increasing frequency because the response of the electronic, atomic and dipolar polarizable units vary with frequency. The ε′ values are attributed due to the charge carriers present in the polymeric material, which migrate upon the application of the field and cause decrease in ε′ due to decrease in space charge carries or interfacial polarization in the polymeric material [33,34].
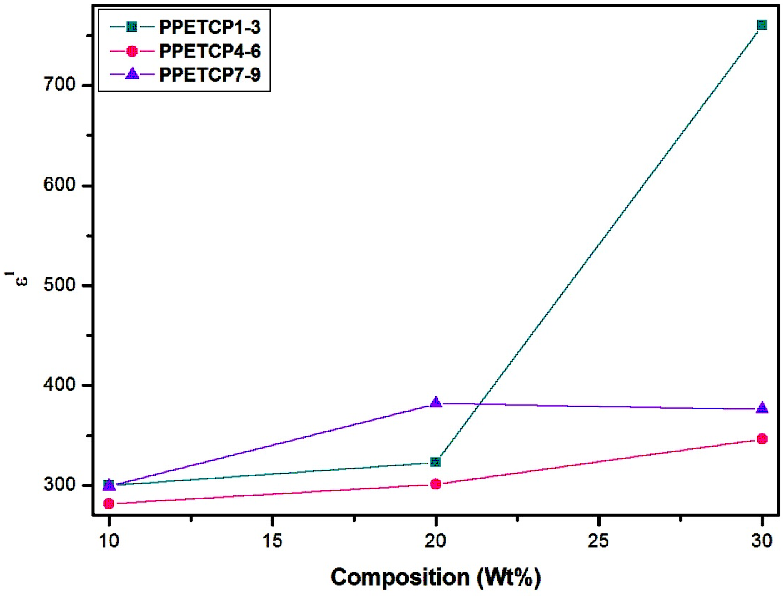
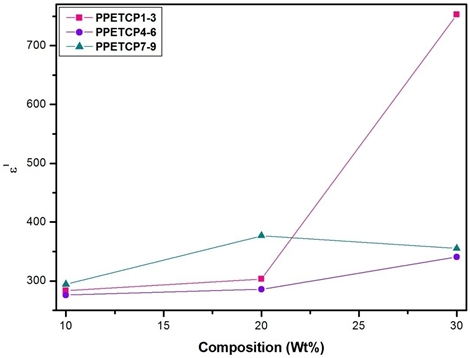
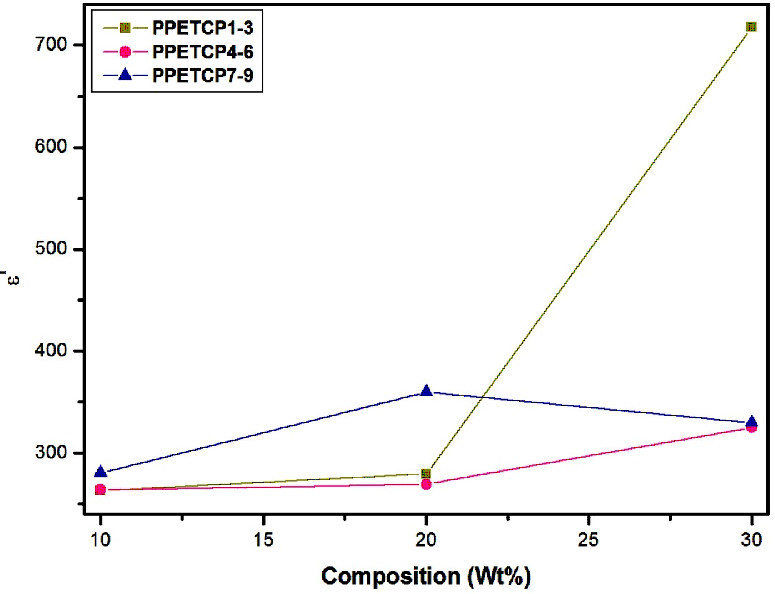
The increase of dielectric constant of a polymer is a main challenge. The PHOP show high value of ε′ (300 at 50 Hz) reported by us [16]. As expected, the ε′ of PPETCP 1–9 are enhanced compared with that of the pure PHOP by increases in the weight percentage of TCMPc inclusion. However, PPETCP 9 with 30 wt% CuTCPc show high ε′ compared with 20 wt% CuTCPc inclusions PPETCP 8 in the frequency range of 50 Hz to 400 Hz. Furthermore, at frequencies above 400 Hz, the ε′ of PPETCP 9 is even lower than that of the PPETCP 8 can be notice clearly in Figure 6. Similar results were observed previously [35, 1]. This phenomenon is probably arising from the Maxwell–Wagner–Sillars (MWS) polarization mechanism [19, 36] which is origin due to large difference in ε′ between the polymer matrix and the CuTCPc [22]. The variation of ε′ with different weight fractions of TCMPc at constant frequency 1 kHz, 10 kHz and 1 MHz are measured at room temperature can be seen in Fig’s. 7, 8 & 9. The PPETCP 1–9 show enhanced dielectric constant values in comparison with bare PHOP. These high dielectric constant polymers can emerge as suitable candidates in electromechanical fields such as high performance sensors, actuators, artificial muscles, as well as bypass capacitors in microelectronics and energy-storage devices.

Figure 7: Variation of dielectric constant with composition (wt %) for PPETCP 1–9 at constant frequency 1 kHz.

Figure 8: Variation of dielectric constant with composition (wt %) for PPETCP 1–9 at constant frequency 10 kHz.

Figure 9: Variation of dielectric constant with composition (wt %) for PPETCP 1–9 at constant frequency 1 MHz.
Frequency dependence of dielectric loss (tanδ)
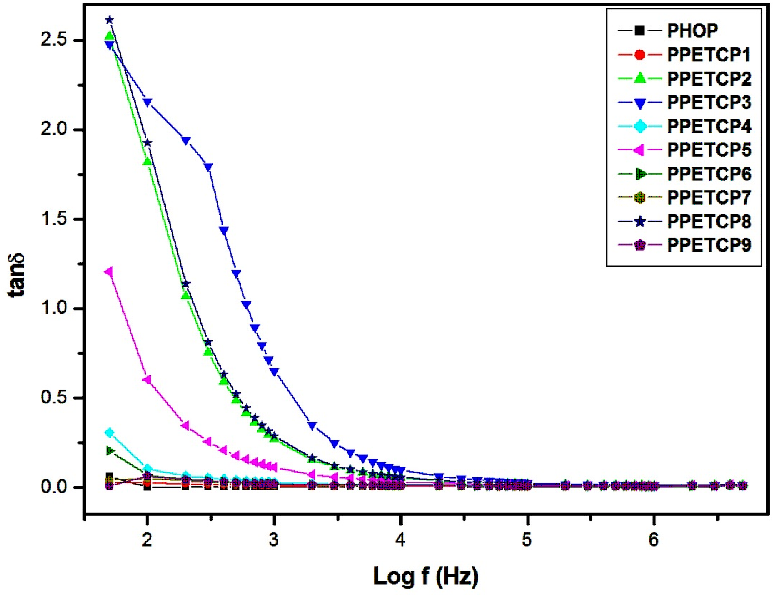
Figures 10 reveals loss factor (tanδ) verses log frequency for PHOP and PPETCP 1–9 polymers. It is observed that the loss factor decreases exponentially with the increase of frequency and finally at higher frequencies reaching an almost constant value. The Figures 10 also displays the dielectric loss values of the polymers and is relatively low over the measured frequency range at room temperature. The PHOP exhibit the low loss factor value 0.06–0.004 in the measured frequency range and for PPETCP 2, 3 & 8 show high loss ~ 2.5 at 50 Hz, PPETCP 5 exhibit loss value ~ 1.25 at 50 Hz frequency and for PPETCP 1, 4, 6, 7 & 9 initially show low loss value vary in the range of 0.3–0.008 at 50 Hz and observe upto 5 MHz. At 5 MHz frequency PPETCP 1–9 exhibit the tanδ value in the range of 0.01 to 0.004. The low dielectric loss results of these polymeric materials can be exploited for the applications in high dielectric constant materials [37].
Figures 10 reveals loss factor (tanδ) verses log frequency for PHOP and PPETCP 1–9 polymers. It is observed that the loss factor decreases exponentially with the increase of frequency and finally at higher frequencies reaching an almost constant value. The Figures 10 also displays the dielectric loss values of the polymers and is relatively low over the measured frequency range at room temperature. The PHOP exhibit the low loss factor value 0.06–0.004 in the measured frequency range and for PPETCP 2, 3 & 8 show high loss ~ 2.5 at 50 Hz, PPETCP 5 exhibit loss value ~ 1.25 at 50 Hz frequency and for PPETCP 1, 4, 6, 7 & 9 initially show low loss value vary in the range of 0.3–0.008 at 50 Hz and observe upto 5 MHz. At 5 MHz frequency PPETCP 1–9 exhibit the tanδ value in the range of 0.01 to 0.004. The low dielectric loss results of these polymeric materials can be exploited for the applications in high dielectric constant materials [37].
Frequency dependence of AC conductivity (σac)
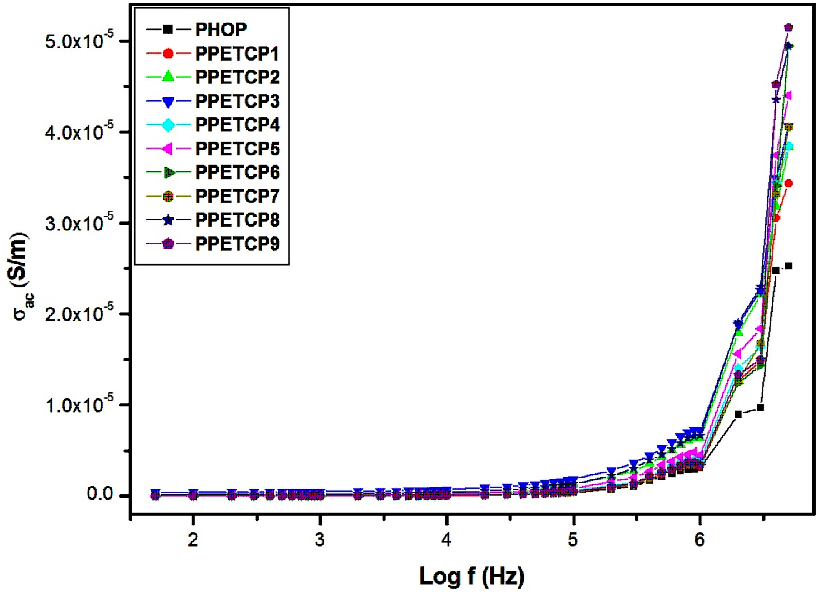
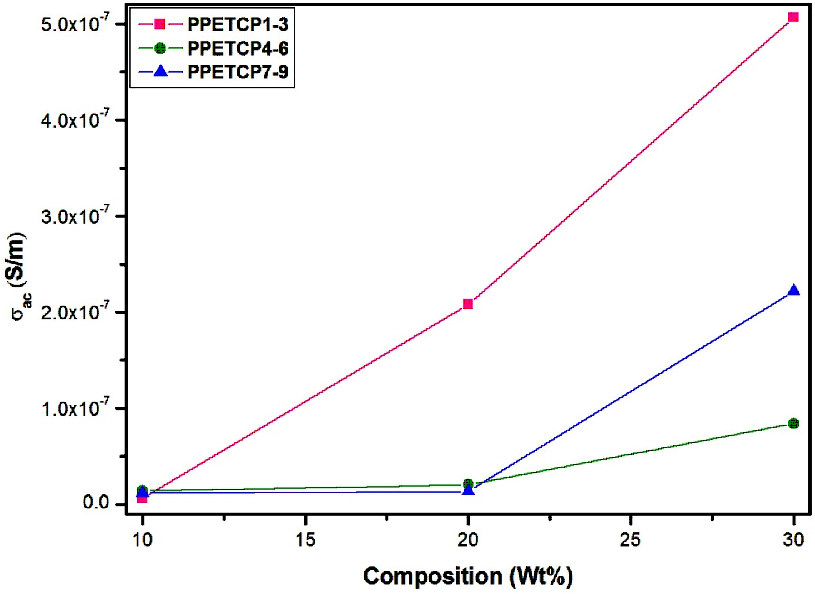
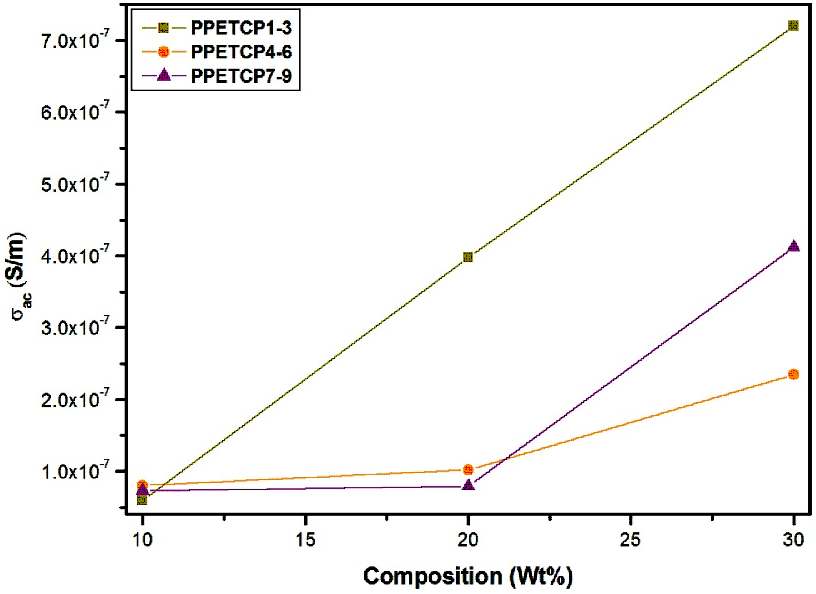
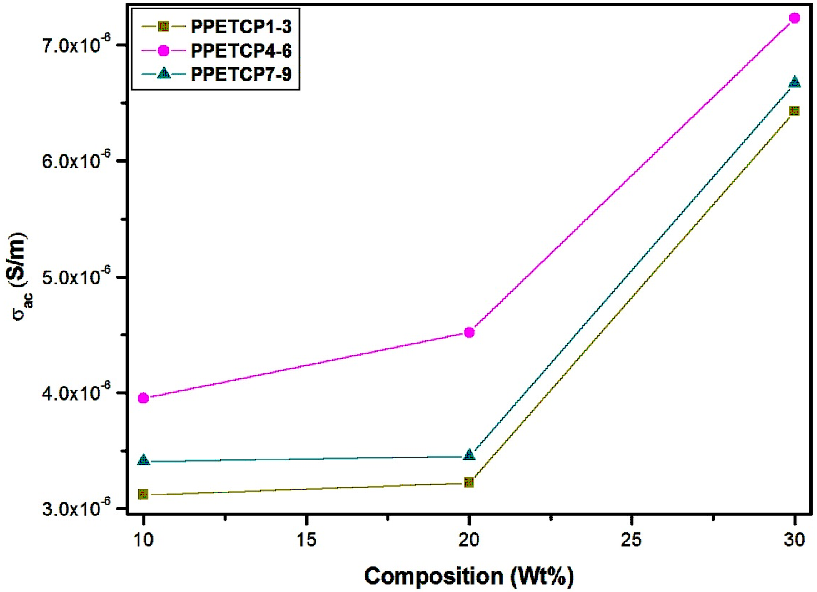
Figures 11 displays the frequency dependence of AC conductivity for PHOP and PPETCP 1–9 at room temperature revealing an increasing trend in the AC conductivity with the increase of frequency, due to an increased density of charge carriers. The AC conductivity of all the polymeric materials exhibit the same trend and resembles with gradient increase in the frequency from 50 Hz to 1 MHz and found to increase suddenly for further increase in the frequency up to 5 MHz [38]. At 5 MHz frequency the PPETCP 1–3, PPETCP 4–6 & PPETCP 7–9 shows the AC conductivity in the range of 3.43x10⁻⁵–4.06x10⁻⁵, 3.84x10⁻⁵–4.94x10⁻⁵ & 4.04x10⁻⁵–5.14x10⁻⁵ (S/m) respectively, the variation of conductivity depends on metal centre and %MPc in the polymer. As the TCMPc inclusion (10, 20 & 30 wt%) increases in the polymer, enhancement of AC conductivity as can be seen clearly in Fig’s. 12, 13 & 14 at constant frequency 1 kHz, 10 kHz and 1 MHz measured at room temperature. The observed trends in frequency dependence of AC conductivity can be explained on the basis of electron hopping model [39].
Figures 11 displays the frequency dependence of AC conductivity for PHOP and PPETCP 1–9 at room temperature revealing an increasing trend in the AC conductivity with the increase of frequency, due to an increased density of charge carriers. The AC conductivity of all the polymeric materials exhibit the same trend and resembles with gradient increase in the frequency from 50 Hz to 1 MHz and found to increase suddenly for further increase in the frequency up to 5 MHz [38]. At 5 MHz frequency the PPETCP 1–3, PPETCP 4–6 & PPETCP 7–9 shows the AC conductivity in the range of 3.43x10⁻⁵–4.06x10⁻⁵, 3.84x10⁻⁵–4.94x10⁻⁵ & 4.04x10⁻⁵–5.14x10⁻⁵ (S/m) respectively, the variation of conductivity depends on metal centre and %MPc in the polymer. As the TCMPc inclusion (10, 20 & 30 wt%) increases in the polymer, enhancement of AC conductivity as can be seen clearly in Fig’s. 12, 13 & 14 at constant frequency 1 kHz, 10 kHz and 1 MHz measured at room temperature. The observed trends in frequency dependence of AC conductivity can be explained on the basis of electron hopping model [39].

Figure 12: Variation of AC conductivity with composition (wt %) for PPETCP1–9 at constant frequency 1.

Figure 13: Variation of AC conductivity with composition (wt %) for PPETCP1–9 at constant frequency 10 kHz.

Figure 14: Variation of AC conductivity with composition (wt %) for PPETCP1–9 at constant frequency 1 MHz.
Conclusions
The phenolphthalein based poly (1,3,4-oxadiazole aryl ether) (PHOP) containing carboxylic acid groups is a high dielectric constant high-performance electroactive polymer (300 at 50 Hz reported). The dielectric constant of PHOP was enhanced further by grafting with high dielectric constant MPc by a simple PPA assisted condensation followed by cyclization approach results PPETCP 1–9 hybrid materials. The ensuing PPETCP 1–9 was successfully characterized and subjected for AC electrical studies. MPc inclusion polymeric materials reveal further enhancement of dielectric constant (320–804 at 50 Hz) and become photoactive by absorbing maximum visible light from 400 to 800 nm with remarkable drop off in optical band gap.
The PPETCP 1–9 shows somewhat less thermal stability compare to bare PHOP, because of the transition from polar functions to non-polar groups cause reduction of the intermolecular attractive forces in the polymer. The high dielectric constant and low dielectric loss exhibited by these hybrid materials in the measured frequency range of 50 Hz to 5 MHz, makes these polymers as potential candidates in advanced studies such as sensors, actuators, artificial muscles, bypass capacitors in microelectronics, energy-storage devices. The AC conductivity for the PPETCP 1–9 was explained by electron hopping model and values are in the range of 3.43x10⁻⁵–5.14x10⁻⁵ (S/m) at 5 MHz measured at room temperature.
Acknowledgements
The authors are grateful to the University Grants Commission (UGC), New Delhi, INDIA, for their financial support.
The authors are grateful to the University Grants Commission (UGC), New Delhi, INDIA, for their financial support.
References
- C. Huang, Q.M. Zhang, J. Yu Li, M. Rabeony, Appl. Phys. Lett. (2005). 87, 182901.
- S. Ashley, Sci. Am. (2003). 289, 52–59.
- Q.M. Zhang, V. Bharti, X. Zhao, Science (1998). 280. 2101–2104.
- R. Pelrine, R. Kornbluh, Q. Pei, J. Joseph, Science (2000). 287. 836–839.
- J.M. Herbert, Ferroelectric transducers and sensors (Gordon and Breach Science Publishers: New York, 1982), pp. 186–191.
- C.J. Dias, D.K. Das-Gupta, IEEE Trans. Electr. Insul. (1996). 3. 706–734.
- C.L. Chochos, G.K. Govaris, F. Kakali, P. Yiannoulis, J.K. Kallitsis, V.G. Gregoriou, Polymer (2005). 46. 4654–4663.
- X.Y. Shang, D. Shu, S.J. Wang, M. Xiao, Y.Z. Meng, J. Membr. Sci. (2007). 291, 140–147.
- Y. Chen, C.K. Liao, T.Z. Wu, Polymer (2002). 43, 4545–4555.
- C. Hamciuc, E. Hamciuc, A.M. Ipate, L. Okrasa, (2008). Polymer 49, 681–690.
- C. Hamciuc, E. Hamciuc, M. Bruma, M. Klapper, T. Pakula, A. Demeter, Polymer (2001). 42, 5955–5961
- C.D. Diakoumakos, J.A. Mikroyannidis, Polymer (1994). 35, 1986–1990.
- A.E. Lozano, J.G. de la Campa, J. de Abajo, J. Preston, (1994). Polymer 35, 872–877.
- A.E. Lozano, J.G. de la Campa, J. de Abajo, J. Preston, J. Polym. Sci. Part A: Polym. Chem. 33, 1987–1994.
- D.J. Liaw, P.N. Hsu, J.J. Chen, B.Y. Liaw, C.Y. Hwang, J. Polym. Sci. (2001). Part A: Polym. Chem. 39, 1557–1563.
- K.M. Pradeep, K.R. Venogopala Reddy, M.N.K. Harish, B. Chidananda, S.D. Ganesh, B.J. Madhu, C.D. Mruthyunjayachari, J. Inorg. (2013). Organomet. Polym. 23, 958–969.
- D. Ren, W. Wei, Z. Jiang, Y. Zhang, (2012). Polym. Plast. Technol. Eng. 51, 1372–1376.
- S. Zhang, C. Huang, R.J. Klein, F. Xia, Q.M. Zhang, Z.Y. Cheng, J. Intell. Mater. Syst. Struct. 18, 133–145 (2007).
- Z.M. Dang, Y. Gao, H.P. Xu, J. Bai, J. (2008). Colloid Interface Sci. 322, 491–496
- J.W. Wang, Q.D. Shen, H.M. Bao, C.Z. Yang, Macromolecules 38, 2247–2252 (2005).
- Q. Wang, W. Jiang, S. Guan, Y. Zhang, J. Inorg. (2013). Organomet. Polym. DOI: 10.1007/s10904-013-9841-x.
- Y. Wang, J.W. Wang, F. Wang, S.Q. Li, J. Xiao, Polym. Bull. (2008), 60, 647–655.
- J.W. Wang, Y. Wang, F. Wang, S.Q. Li, J. Xiao, Polymer (2009). 50, 679–684.
- C. Huang, Q.M. Zhang, Adv. Funct. Mater. (2004). 14, 501–506.
- 25. G. Maglio, R. Palumbo, M. Tortora, M. Trifuoggi, G. Varricchio, Polymer (1998). 39, 6407–6413.
- G.S. Liou, N.K. Huang, Y.L. Yang, Eur. Polym. J. (2006). 42, 2283–2291.
- I. Sava, M.D. Iosip, M. Bruma, C. Hamciuc, J. Robison, L. Okrasa, T. Pakula, Eur. Polym. J. (2003). 39, 725–738.
- E.R. Hensema, J.P. Boom, M.H.V. Mulder, C.A. Smolders, J. Polym. Sci. Part A: Polym. Chem. (1994). 32, 513–525.
- X. Song, Y. She, H. Ji, Y. Zhang, Org. Process Res. Dev. (2005). 9, 297–301.
- E.M. Maya, G. de la Torre, A.E. Lozano, T. Torres, J.G. de la Campa, J. de Abajo, Macromol. Rapid Commun. (2006). 27, 1852–1858.
- B.N. Achar, T.M. Mohan Kumar, J. Porphyrins Phthalocyanines(2007). 11, 42–49.
- D. Schmaljohann, L. Haußler, P. Potschke, B.I. Voit, T.J.A. Loontjens, Macromol. Chem. Phys. (2000). 201, 49–57.
- A. Broido, J. Polym. Sci., Part B: Polym. Phys. (1969). 7, 1761–1773.
- A.K. Ray, S.M. Tracey, A.K. Hassan, IEE P-Sci. Meas. Tech. (1996). 146, 205–209.
- V. Gupta, A. Mansingh, Phys. Rev. B. (1994). 49, 1989–1995.
- H.S. Xu, Y. Bai, V. Bhariti, Z.Y. Cheng, J. Appl. Polym. Sci. (2001). 82, 70–75.
- J.Y. Li, Phys. Rev. Lett. (2003). 90, 217601.
- J.W. Wang, Y. Wang, F. Wang, S.Q. Li, J. Xiao, Q.D. Shen, Polymer, (2009). 50, 679–684.
- I. Murtaza, I. Qazi, K.S. Karimov, M.H. Sayyad, Physica B, (2011). 406, 1238–1241.
Citation: Pradeep K Musturappa, Venugopala KR Reddy, Harish MN Kotresh., et al. (2018). Dielectric Studies of Tetra Carboxy Metalphthalocyanines Anchored Phenolphthalein Based Poly (1, 3, 4-Oxadiazole Arylene Ether) S. Archives of Chemistry and Chemical Engineering 1(1).
Copyright: © 2018 Venugopala KR Reddy. This is an open-access article distributed under the terms of the Creative Commons Attribution License, which permits unrestricted use, distribution, and reproduction in any medium, provided the original author and source are credited.

