Research Article
Volume 7 Issue 1 - 2025
The Resurgence of Hospital Inflation: Analysis and Implications for Forensic Practitioners
LSU Medical Centre, New Orleans, LA 70112, USA
*Corresponding Author: Bernard Pettingill, PhD, Consulting Economist LSU Medical Centre, New Orleans, LA 70112, USA.
Received: January 18, 2025; Published: January 27, 2025
Abstract
Recent data from the Bureau of Labor Statistics (BLS) reveal a significant shift in hospital and related medical service costs during 2024, marking a return to historically higher growth rates for medical inflation. This paper examines the implications of this trend for forensic economists and accountants, particularly for damage calculations in catastrophic personal injury cases. Through an analysis of both long-term patterns (2001–2024) and more recent data (2023–2024), we offer practical guidance for addressing these evolving conditions.
Introduction
Accurate measurement and forecasting of medical care costs are critical in damage calculations involving catastrophic patients. As of 2024, the hospital and related services growth rate has risen to 5.69%, up from 4.31% in 2023, reflecting a resurgence reminiscent of early-2000s levels. This shift carries significant implications, given that many forensic practitioners historically have utilized uniform medical cost inflation rates in making forecasting calculations.
When the new figures are compared to other medical care categories, professional services (1.81%) and prescription drugs (1.22%), a marked divergence emerges. Forecasters often rely on a single inflation factor across all medical indices to measure future medical costs, and this method will lead to imprecise and understated damages, especially when hospital expenses constitute a substantial portion of projected costs.
Data and Methodology
This analysis relies on the BLS Consumer Price Index (CPI) data for medical care components, spanning 2001 to 2024. Three key categories—Hospital and Related Services, Professional Services, and Prescription Drugs form the basis for the comparisons. The below calculations include:
- Annual growth rates of each category;
- Long-term averages (e.g., 30-year, 15-year, 5-year) to observe trends; and
- Recent year-over-year rates to pinpoint shifts for the years 2023 to 2024.
Limitations
- BLS Revisions: The BLS often update historical data, possibly affecting multi-year averages.
- National Averages: The figures do not capture regional variations or specific hospital delivery systems.
- Payer Differences: Actual costs can vary significantly among Medicare, Medicaid, private insurance, and out-of-pocket payers.
Analysis of Medical Cost Growth Rates
Historical Patterns and Recent Developments
BLS data indicate that hospital costs have a history of cyclical peaks over multi-year intervals, with the latest increase pushing annual hospital cost growth to a staggering 5.69%. In contrast, other categories such as professional services and prescription drugs—are already at or below 2%.
| Category | 30-Year Average | 15-Year Average | 5-Year Average |
| Hospital and Related Services | 5.10% | 4.47% | 3.47% |
| Professional Services | 2.77% | 2.54% | 0.82% |
| Prescription Drugs | 3.06% | 2.54% | 0.82% |
Source: BLS CPI for Medical Care Components (2001–2024)
Table 1: Medical Cost Growth Rates Across Different Time Horizons.
Table 1: Medical Cost Growth Rates Across Different Time Horizons.
While short-term moderation occurred in the early 2020s for the Hospital and Related Services Category, the jump to 5.69% suggests that recent lower rates may have been temporary rather than a lasting trend. This upward movement in 2024 accentuates the need for careful category-by-category inflation assumptions when forecasting medical and hospital care rates in any damage model.
Hospital Cost Trends
Hospital services have historically been a key driver in overall medical inflation. Figure 1 below illustrates the year-over-year growth in Hospital and Related Services from 2001 to 2024, based on BLS data. The chart shows a cyclical pattern, with higher spikes in the early 2000s, a moderation phase in the early 2020s, but a significant uptick in 2024.
Hospital services have historically been a key driver in overall medical inflation. Figure 1 below illustrates the year-over-year growth in Hospital and Related Services from 2001 to 2024, based on BLS data. The chart shows a cyclical pattern, with higher spikes in the early 2000s, a moderation phase in the early 2020s, but a significant uptick in 2024.
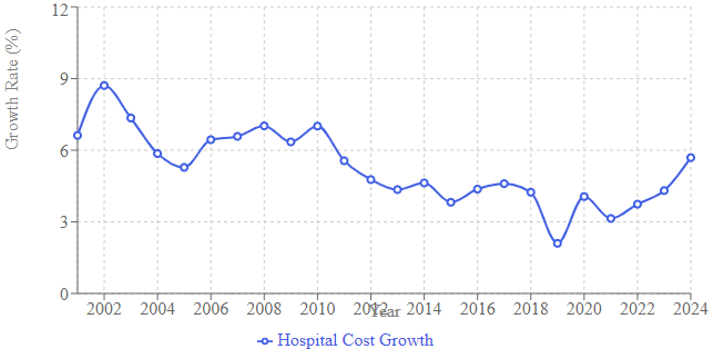
Figure 1: Trend in Hospital and Related Services Growth Rates, 2001–2024 (BLS).
Observing this cyclical movement highlights how hospital costs can surge more rapidly than other medical categories for a variety of reasons, including but not limited to hospital consolidations, labor shortages, technology investments, and changes in reimbursement rates. Practitioners should be aware that these fluctuations may continue, especially if systemic factors drive further volatility.
Implications for Forensic Practitioners
Category-Specific Approaches
The significant gap between hospital services (5.69%) and other medical inflation categories underscores why relying on one uniform inflation rate can lead to inaccuracies—particularly cases with a high proportion of hospital-based future care.
Category-Specific Approaches
The significant gap between hospital services (5.69%) and other medical inflation categories underscores why relying on one uniform inflation rate can lead to inaccuracies—particularly cases with a high proportion of hospital-based future care.
- Separate Growth Rates
- Practitioners should now consider assigning a higher rate for hospital-related costs and a lower one for ancillary services (e.g., professional services, prescription drugs – see Table 1).
- Weighting by Composition
- When projecting future care, each category should be weighted based on anticipated demand for services. A case involving multiple surgeries, for instance, would disproportionately involve hospital services, requiring computing the higher rate of hospital inflation.
Illustration: Projected Damages
To demonstrate the effect of weighting category-specific rates vs. a single measure, consider a 20-year projection of $5 million in future medical needs, apportioned among hospital services (60%), professional services (25%), and prescription drugs (15%).
To demonstrate the effect of weighting category-specific rates vs. a single measure, consider a 20-year projection of $5 million in future medical needs, apportioned among hospital services (60%), professional services (25%), and prescription drugs (15%).
| Cost Category | Initial Amount | *Category-Specific Method (Rate Used) | Uniform Rate Method (3.2% Used) |
| Hospital Services | $3.0M (60%) | $4.92M (5.10%) | $4.38M (3.2%) |
| Professional Services | $1.25M (25%) | $1.89M (2.77%) | $1.83M (3.2%) |
| Prescription Drugs | $0.75M (15%) | $1.39M (3.06%) | $1.09M (3.2%) |
| Total Projected | $5.0M | $8.20M | $7.30M |
Table 2: Comparison of Damage Calculation Methods – $5M Future Medical Needs Case (20-Year Projection).
Note: Category-specific rates utilize the 30-year averages from Table 1. The uniform rate of 3.2% is the overall medical CPI 30-year average. Using category-specific rates vs. a uniform medical CPI rate yields a 12% difference in projected damages ($8.2M vs. $7.3M) over a 20-year period of future care.
This 12% gap illustrates how methodological differences can significantly skew damage awards. Practitioners who default to a single medical inflation rate risk underestimating awards, especially when hospital services dominate the future forecasts.
Conclusion
The resurgence of hospital services inflation growth in 2024 signals a return to historical patterns of higher medical inflation. Given that other categories, professional services and prescription drugs, have maintained considerably lower rates, forensic economists and accountants should adopt a category-specific growth methodology for more accurate damage projections. These findings underscore the importance of regularly reviewing BLS data, recognizing potential regional or payer-level nuances, and proactively adjusting methodologies to reflect evolving market conditions.
References
- U.S. Bureau of Labor Statistics. (2024). Consumer Price Index
- U.S. Bureau of Labor Statistics. (2024). Measuring Price Change in the CPI: Medical Care. https://www.bls.gov/cpi/factsheets/medical-care.htm
Citation: Sean P. Escoffery and Bernard F. Pettingill. (2025). “The Resurgence of Hospital Inflation: Analysis and Implications for Forensic Practitioners”. Journal of Medicine and Surgical Sciences 7.1.
Copyright: © 2025 Bernard F. Pettingill. This is an open-access article distributed under the terms of the Creative Commons Attribution License, which permits unrestricted use, distribution, and reproduction in any medium, provided the original author and source are credited.